Under the tag “When theory meets practice” we publish analyses of currency pairs, which after a few days we check the verifiability, and the basis for verification is the comparison of the current situation with the forecasted on the analyzed instrument. This approach to analysis gives us the opportunity to find the weak side of the strategy and minimize the possibility of making the same mistake in the future. Analyses will be done according to different strategies, so everyone will find something for themselves and there will be an opportunity to assess their effectiveness, eliminate erroneous assumptions and use them in their trading.
USDCHF 20.02-02.03.2019
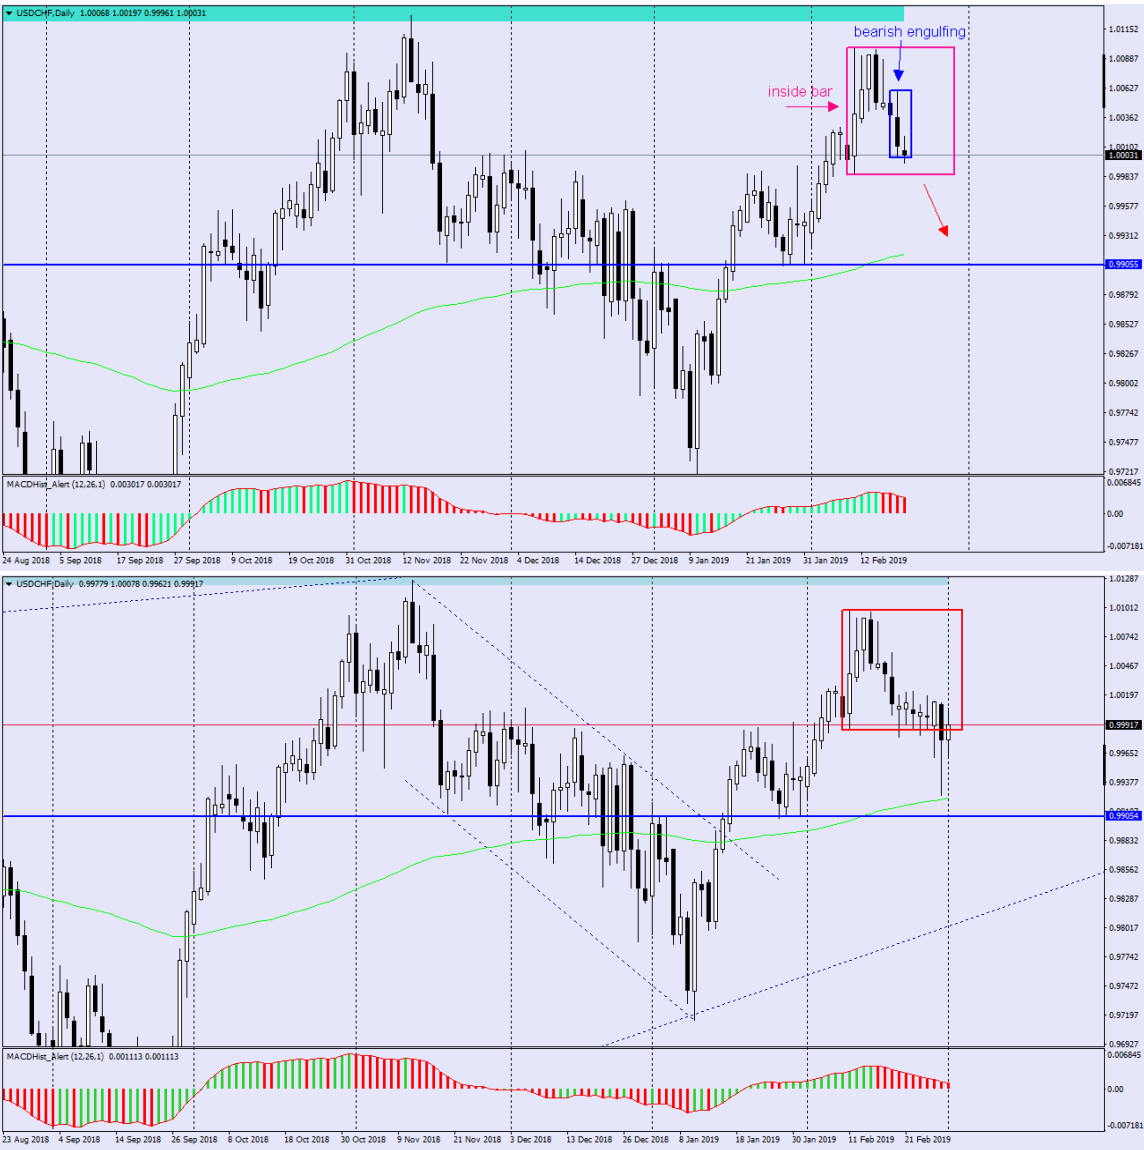
I must admit that when I wrote this analysis – “USDCHF – FOMC minutes can move the market – Bearish Engulfing also” – I did not expect that I would have to wait more than a week for the realization of the forecasts included in the analysis. I predicted the continuation of the falls on the basis of two Price Action formations: On the daily chart, when we look at it from the point of view of Technical Analysis, an interesting situation emerged. We have two Price Action formations contained in one another: the Inside Bar created by a candle from February 11 and the Bearish Engulfing contained therein, which was created by yesterday’s bearish daily candle. It is worth paying particular attention to the latter formation because it was created right after the bearish pin bar and gives a fairly strong sell signal. “. After a few days of consolidation, the price decided to go in “my” direction and made 80p. Currently, the quotations are returning to the parity level of 1:1 USD:CHF.
USDJPY 25.02 – 02.03.2019
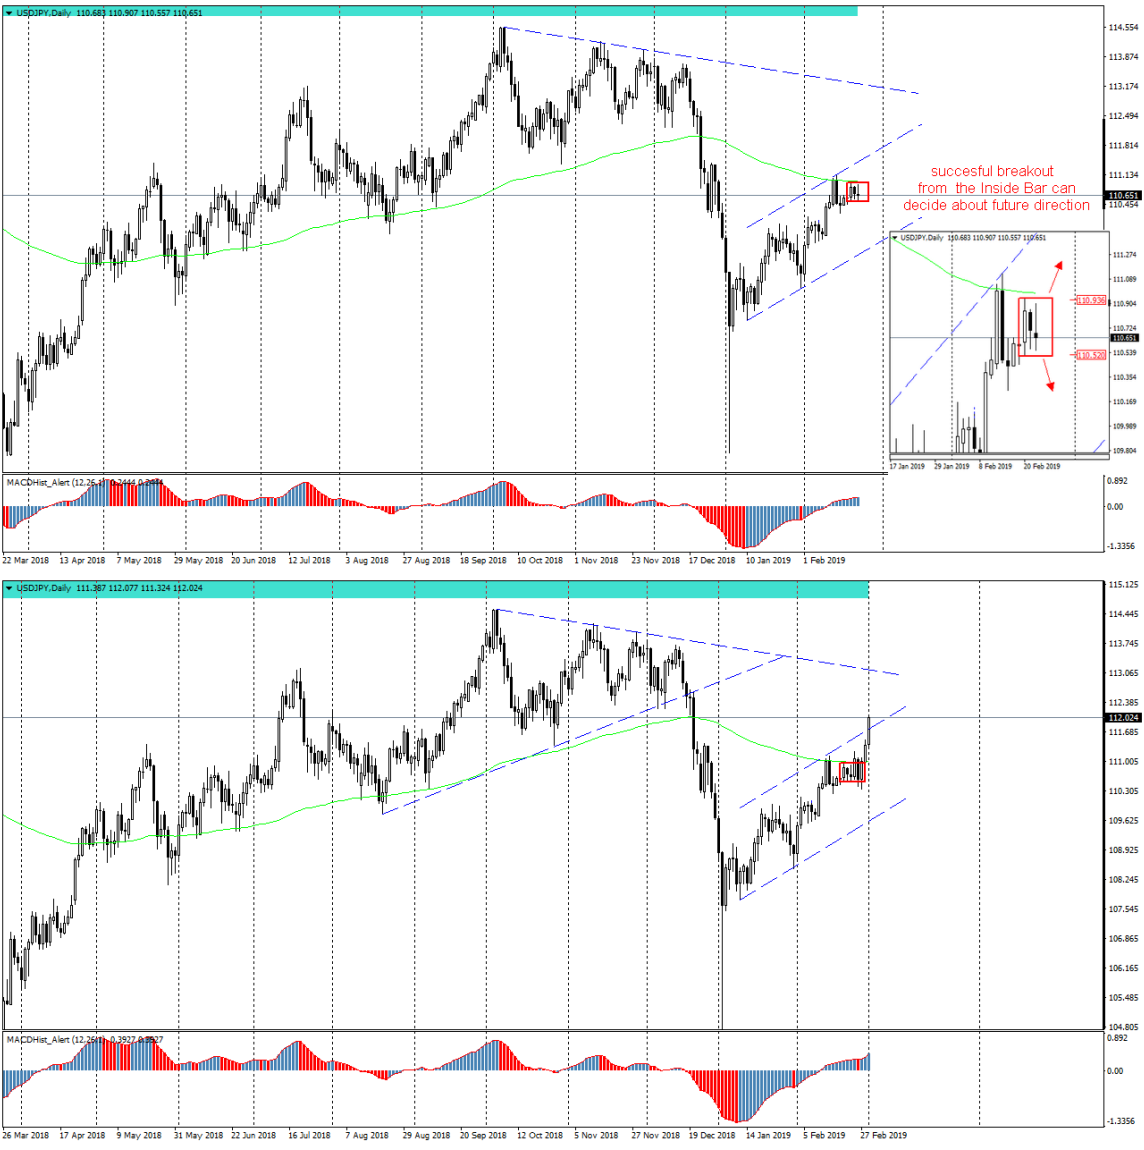
Analyzing this pair: “USDJPY – Inside Bar on Daily“, according to the title, the breakout from the formation was supposed to decide about the further fate of this pair. I expected the Inside Bar to be broken down, but the condition to enter the market was confirmed closing of the daily candle below or above the IB range – “On the daily chart, we can see that the candle from 20.02 contains quotations from subsequent sessions creating Inside Bar formation. According to the PA+MACD strategy, if the breakout from the Inside Bar is accompanied by the appearance of the maximum on the MACD histogram and the oscillator starts to decrease – we can expect drops. Therefore, it is worthwhile to follow the quotations of this pair and join after the confirmed overcoming of the lower IB limit at the level of 110.50″.
It was a theory….and the practice turned out to be a bit more complicated… the price wobbled within the formation for a few days and the first breakout from the IB took place at the top, then the price returned to the formation, then knocked it down, but it turned out to be a false breakout – because without confirmation and the closing of the daily candle took place in the IB… and finally on Wednesday the price went north and climbed dynamically until the end of the week. I have to admit that it turned out to be a very spectacular breakout from the IB because in 2 days the price gained 120p.


 Review")


