 Looking at the chart of the history of the CADJPY pair quotations we will notice that the current rate of this pair is 4400p lower than the historical maxima of 2007, which is 125.60, and only 1270p above the minimum of all time 68.57. It is possible that the time has come for increases on this pair.
- confluence of support on 81.30
- after breaking out of the triangle, an inside bar appeared
Since mid-March this year, the pair has been moving in a moderate upward trend, and the lines connecting the maxima and minima of this trend determine the support and resistance of the triangle formation.
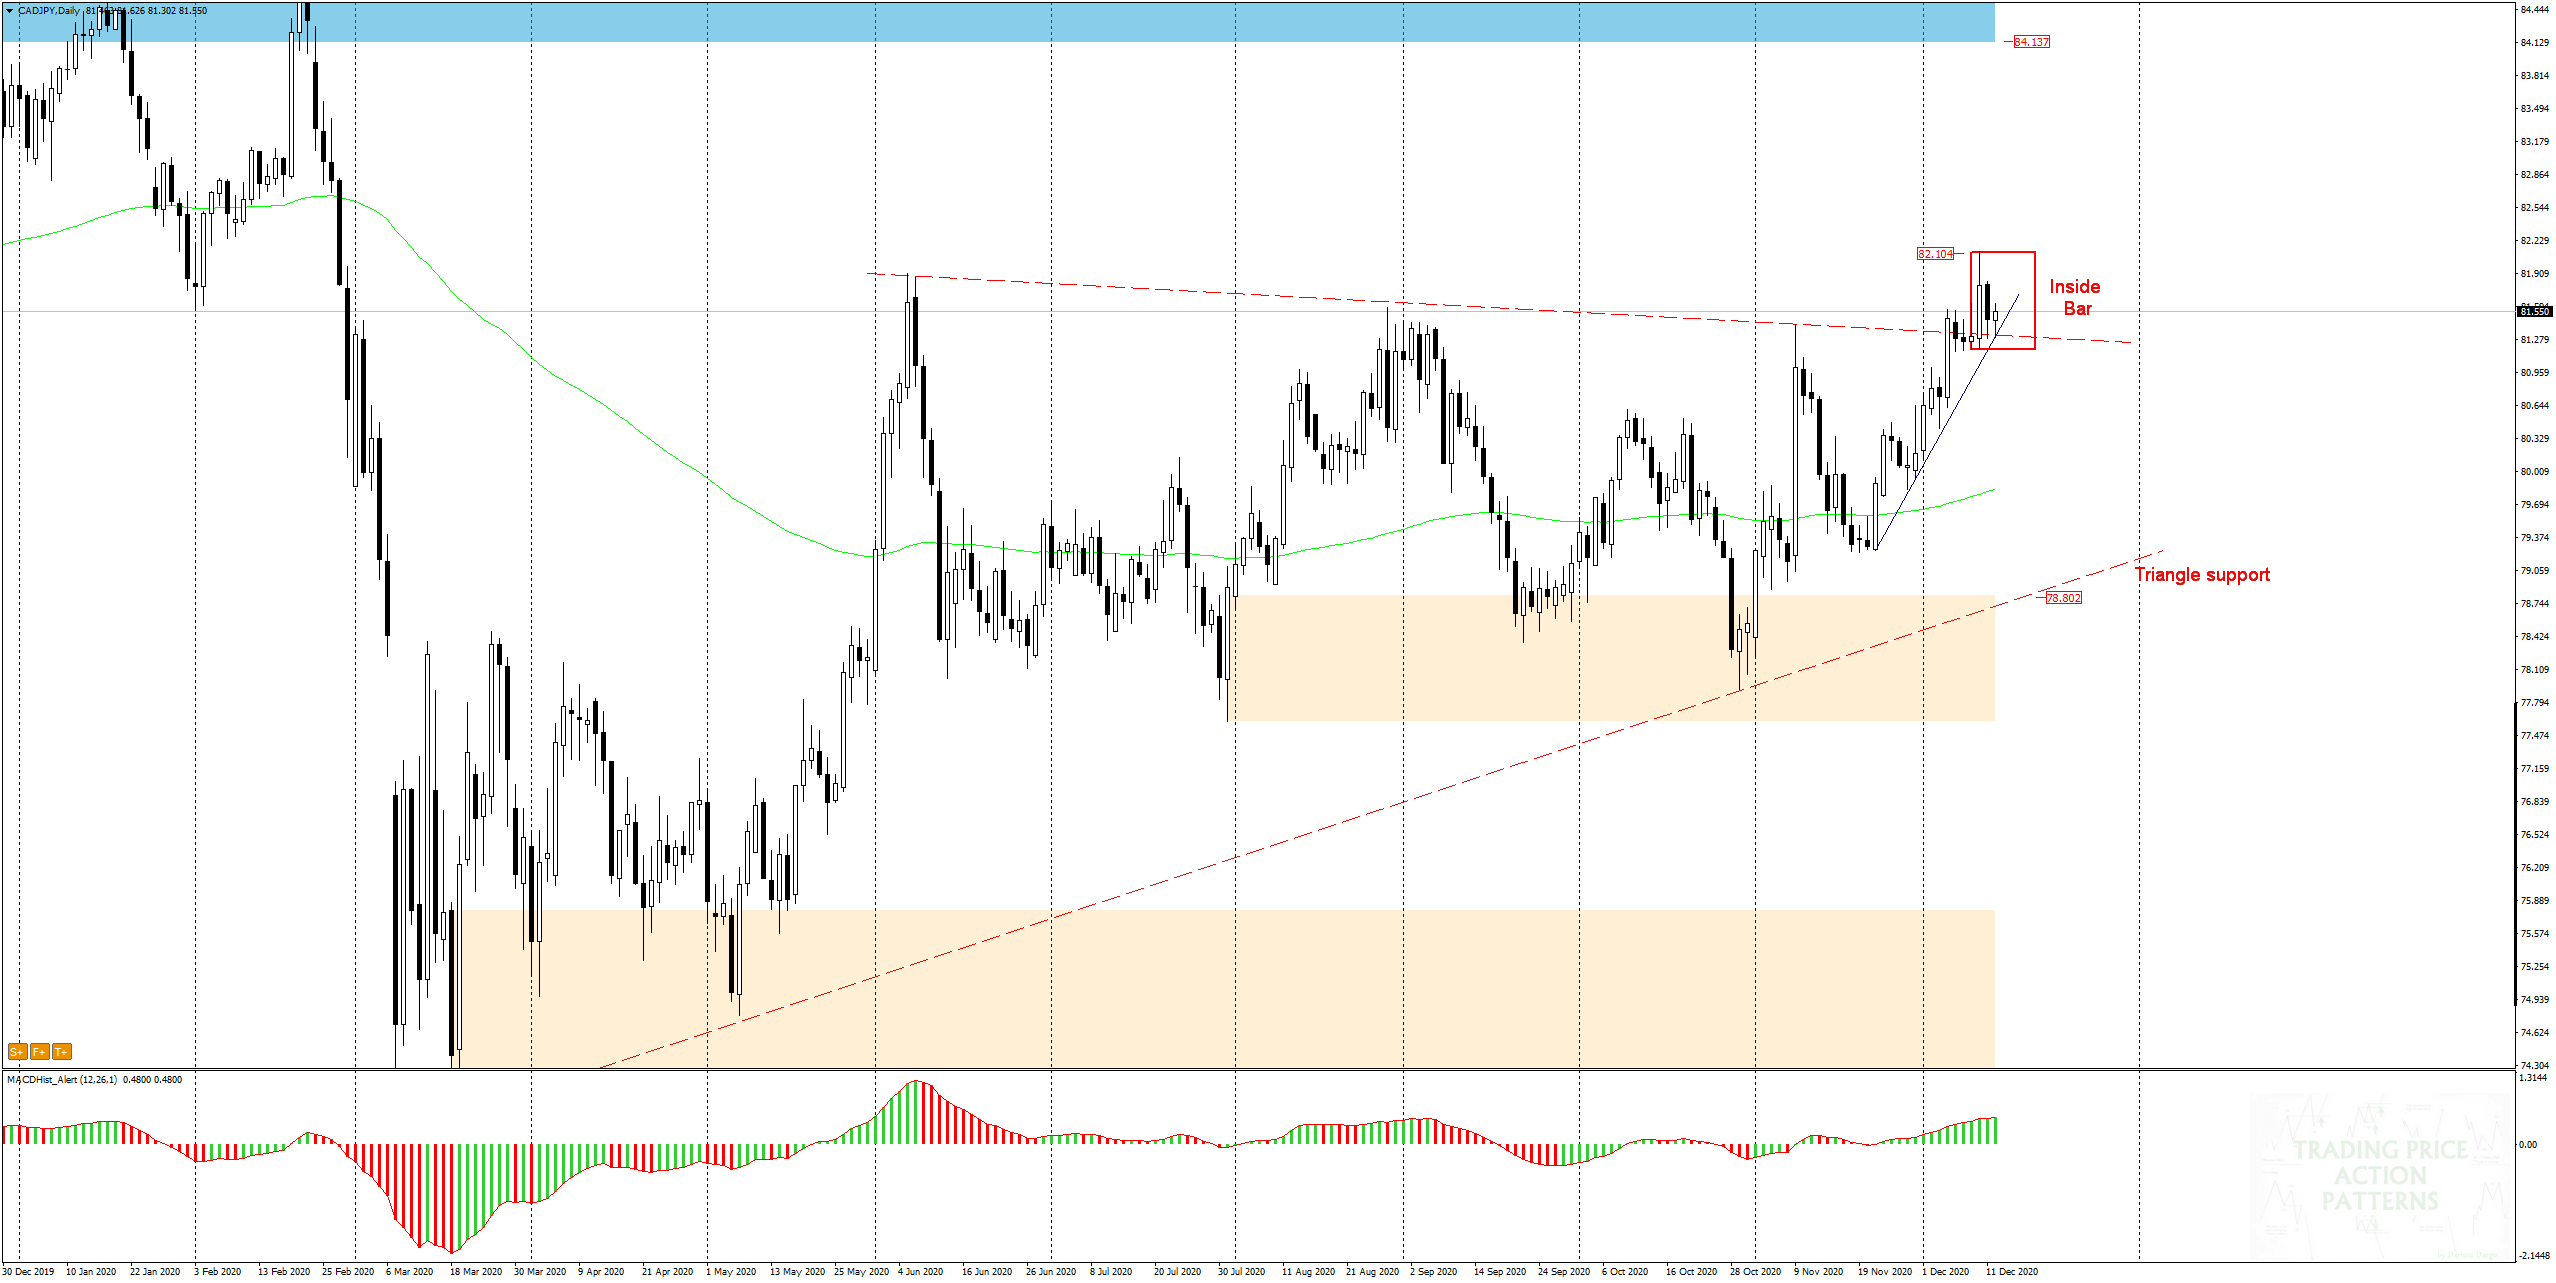
Last week, the price broke the top of this formation.
The daily candle that broke out from the triangle, with the two following, formed an inside bar .
Inside bar formed at a level where is a confluence of support – a triangle resistance and a blue trend line.
If the price breaks out from the formation, it will be a signal to continue to grow, but a downward trend can not be excluded if the mentioned blue trend line is broken.

On the H4 chart we also note that the last few weeks the price has been moving in a fairly regular upward trend and the local trend line (blue) has not been overcome despite several attempts.
Breaking up from the inside bar would be a good signal to take the buy position.
However, if the price goes south and breaks out of the formation down, then taking a sell position requires confirmation by change of the MACD to bearish.
Currently the MACD for D1 and H4 is bullish, which suggests that an upward move is more likely.
I also recommend this stuff:
Trading with PA+MACD, or how to increase the probability of winning
ongoing analysis https://t.me/TradewithDargo


 Review")


