Combining Pin Bars And Support And Resistance Levels
A key aspect in trading in the forex platform is having a clear strategy in making your trades. Almost all traders have a particular approach in trading courtesy of their own individual strategies that favor them. A strategy is not a strategy without the backing of technical analysis. The analysis supports the strategy by proving its usability and adaptability in relation to different trading situations that will present in this course.
Among the strategies that many traders use, the one that sticks out from the rest is the pin bar and support and resistance levels. The uniqueness of this strategy is the combination of two trading analytics and tools into one which has the effect of bringing out a great approach
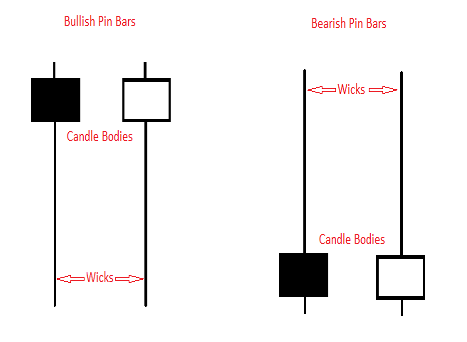 The Pin Bar the pin bar strategy is a great strategy that will help a trader in the determination of the exact point of a price in the case of a price reversal. The pin bar looks exactly like the pin bar in structure and it is mostly used in tandem with candlestick charts.
It also serves to provide a clear insight on whether you are getting into traps or ho proper you will fit in an upcoming trend in the markets. The pin bar forms a new low level in a low trend and a new up level in an appreciating trend. This serves as a great indicator in forex trading in terms of the best market positions where one can either buy or sell.
Pin bars are great on all timeframes throughout the week. They are, however, shown to be more accurate when the timeframe in question is over an hour long.
The Support And Resistance Levels
 The support and resistance levels is a great trading strategy that will give the trader reliable information on the price mobility of a product in question. The terms support and resistance are used to denote various standings of the price performance in relation to the market.
Support in this context denotes the lowest point that a market reaches before its starts appreciating back to normalcy again. Resistance, on the other hand, denotes the highest point in which a market reaches before the prices begin to drop again. With these two concepts grasped, a trader can make a strong decision on how to trade as guided by these two levels.
The support level can indicate the best level for a trader to start buying into the market when the prices are rather low. The resistance level, on the other hand, can be an indication of the best price level to sell out of the market. These two parameters will guide the trader on the best positions that he or she can take advantage of to increase their earnings.
This strategy is also a good analytical tool that will give an insight into the market condition but not in such a clear way. At least one can pinpoint the current market values, especially when using the candlestick chart.
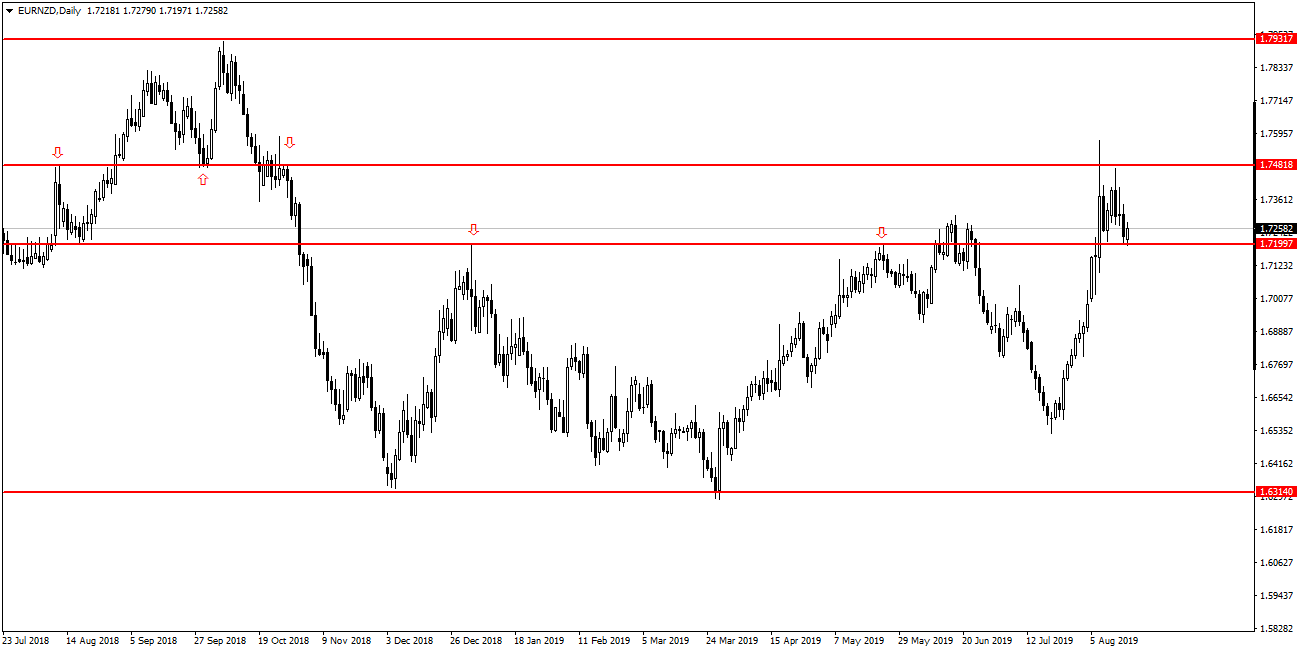
The Support And Resistance Levels Combined With The Pin Bar
The fusion of these two great strategies forms one formidable approach that if used in the right way will guarantee the trader excellent and accurate rests. Both of these two will be great for technical analysis when used on a candlestick chart. They will be able to pinpoint the best trading levels as well as the best time to take advantage of these levels. The great part I that the combination of these two strategies will give a clear picture concerning many aspects at once in time, price, reversal and also mobility.
Conclusion
Traders often try to come up with various trading strategies to help them out in their trading activities. To get new strategies, they will often modify old strategies to come up with a stronger end approach. The combination of the pin bar and the support and resistance levels strategies gives rise to one of the best approaches that a trader can use.


 Review")


