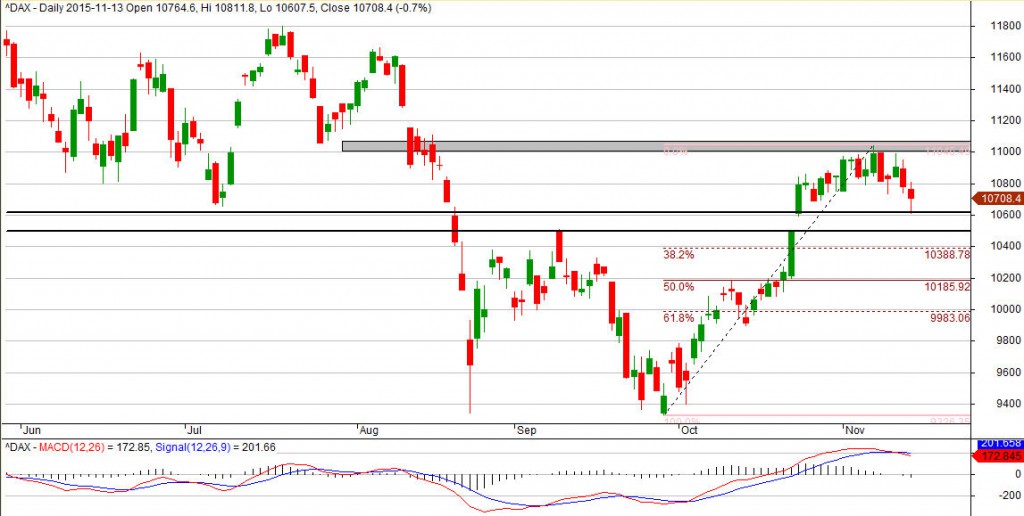
Last week bears started to dominate. After another try of bulls to break above 11,000 pts situation change and the had to defend supports at 10,800, 10,700, 10,600 pts. On DAX chart index stopped at low from October 23rd. As long as 10,500 level is not broken, there can still be increases. Unfortunately it is not probable because still there was no test of first fibo 38.2% which is next to 10,400 area. MACD also give bearish signal and this indicator often works on DAX.
IF YOU ARE INTERESTED IN INVESTING ON INDICES LIKE DAX30, TRY FREE FXGROW ACCOUNT
In long term period nothing changed since last week. As I wrote in last analysis: “Current gains can be big correction wave B in bearish ABC pattern. In this case in the nearest time we should see bearish move and deepening of this year’s low. The second possibility is that DAX ended correction and currently is in new bullish wave. This new impulse can improve historical top. it is not possible now to say which scenario is true”. In the second case correction can be wave 2 in bullish impulse. It often retrace 76.8% of wave 1 – in this situation to 9,700 pts level. It is also possible to end correction earlier on fibo 61.8%, which is at 10,000 pts.
Gains can be caused by ECB actions which doesn’t exclude another rates cut on next meeting. The most important data in the next few days: US CPI on Tuesday, FOMC minutes on Wednesday.


 Review")


