USDJPY
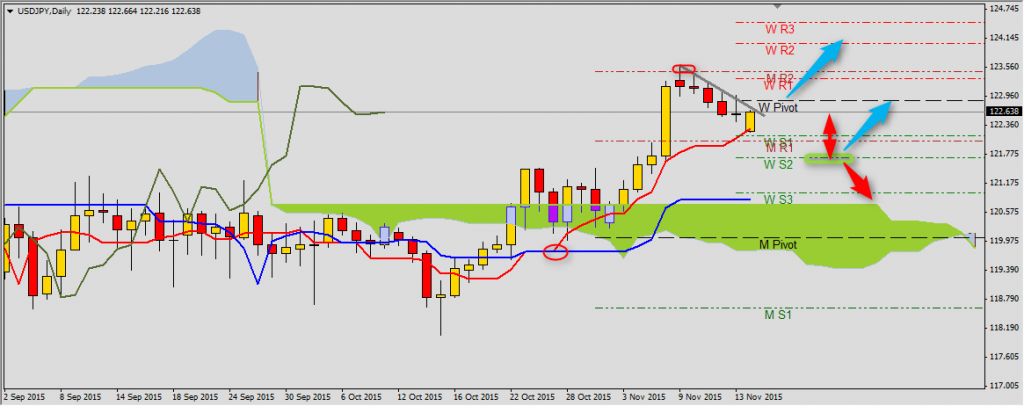
Today this pair is in very interesting position. Although price stays above Tenkan-sen 122.30 but below weekly pivot 122.86. Another support levels are set by monthly R1 122.03 and then weekly S2 121.69. Decrease below this level will mean USDJPY going to side trend. Breaking weekly pivot will be a sign of breaking price out of bearish channel in which this pair stayed for last week. I wait for buy signal consistent with last trend with a range to monthly R2 123.45 and then R2 124.04 and R3 124.47.
You can read Ichimoku strategy description here.
GBPUSD
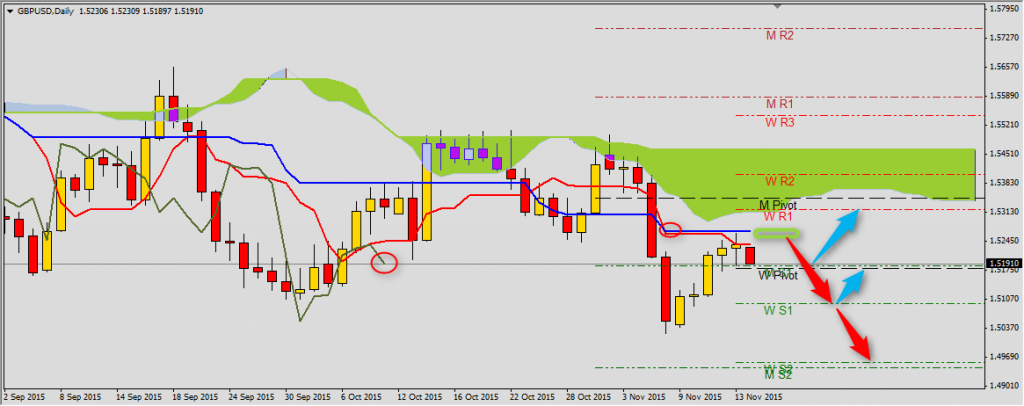
This pair is getting closer to support 1.5185-1.5179 set by monthly R1 and weekly pivot. Breaking this area will confirm sell signal generated by Ichimoku lines and it will be a sign that last gains to Kijun-sen 1.5267 were just a correction. The range is set by weekly S1 1.5095 and then S2 1.4955. Breaking above Kijun-sen will mean going to side trend with monthly pivot range 1.5346.
YOU CAN TRADE USING ICHIMOKU STRATEGY WITH FREE FXGROW ACCOUNT.
EURAUD
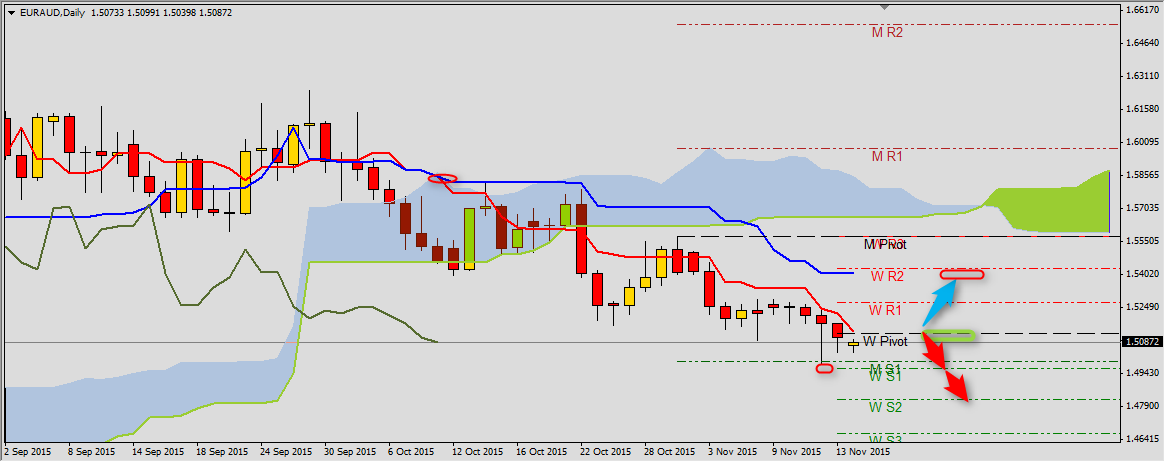
This pair stays below Tenkan-sen which additionally covers weekly pivot 1.5126. Price staying below this lwvwl will be a sign of decrease to monthly S1 1.4996 tested on November 12th and – if this level will be broken – to weekly S2 1.4821. Breaking Tenkan-sen will mean that there will be correction of bearish trend to weekly S1 1.5268 and then second level of balance Kijun-sen 1.5402.


 Review")


