The DAX30 is the most important German stock index. It is the so-called Performance Index, which means that it takes into account not only the increase in stock prices but also the increase in capital through the payment of dividends. It is the most important index of the German Stock Exchange (Frankfurter Wertpapierbörse, Frankfurt am Main). It shows the change in the value of shares of the 30 largest joint-stock companies in terms of capitalization and turnover. Each company is given a weight that is appropriate to its size. The index is calculated using the XETRA electronic trading system. It is calculated from 9.00 a.m. to 5.30 p.m. Currently, the DAX index is calculated every second. That’s as much for the introduction. And now let’s go to the specifics…. i.e. the analysis of the chart of this index.
I have a little bit of stage fright, because for the first time in few years I have been analysing this instrument and recently I have not been interested in it at all, and I do it on the basis of two different strategies, which, as it turns out, suggest contradictory results. And I have to choose something…
Let’s look at the German index in terms of Price Action+MACD strategy:
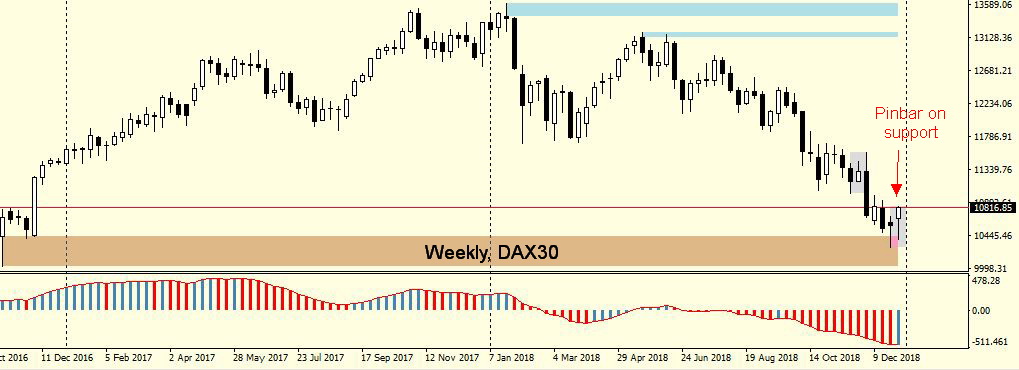
Beginning with the weekly chart, we will notice two further bullish pinbars, which formed in an important demand zone defined by the December 2016 quotations. In addition, the last weekly candle created a minimum for the MACD, which is starting to grow.
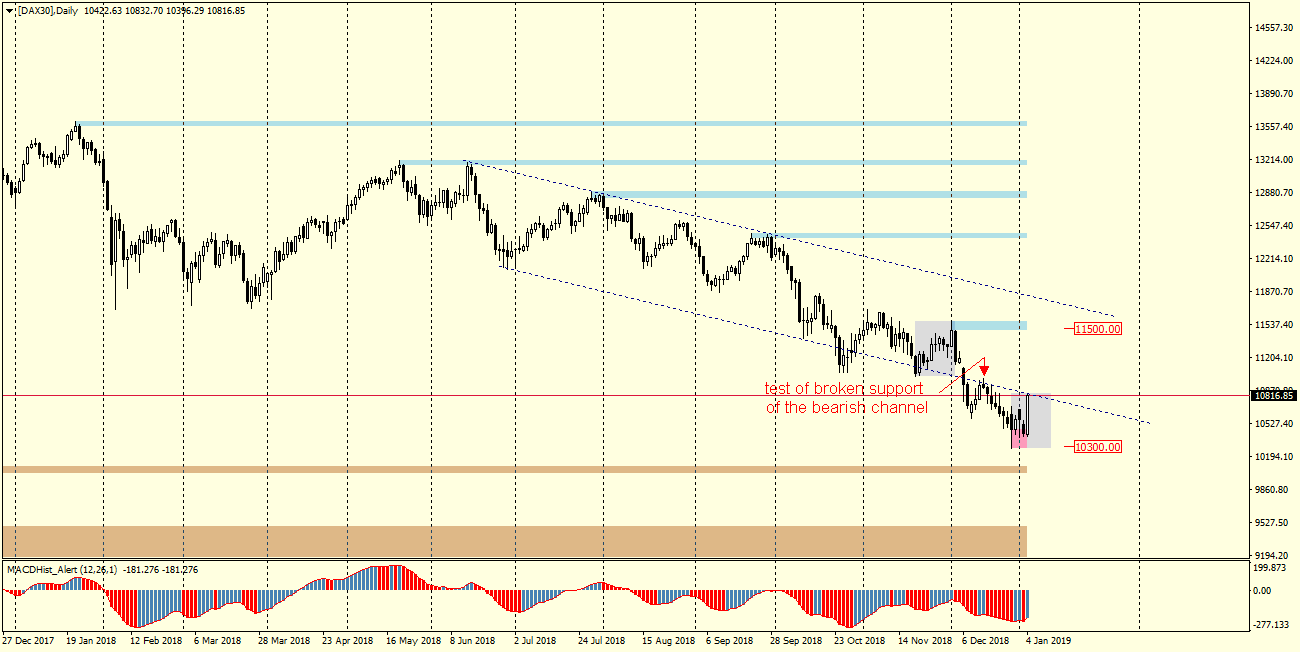
Going to the daily chart (below) we can roughly determine the downward channel, from which the index broke down at the beginning of December last year and tested a few days later from the bottom the channel’s beaten support. Currently, the index is testing this support again from below. On MACD there is an upward divergence (+)
To sum up: according to the PA+MACD strategy, I bet on growth with TP at the level of 11450. Stop Loss in the area of 10500.
And now another approach – OverBalance Strategy:
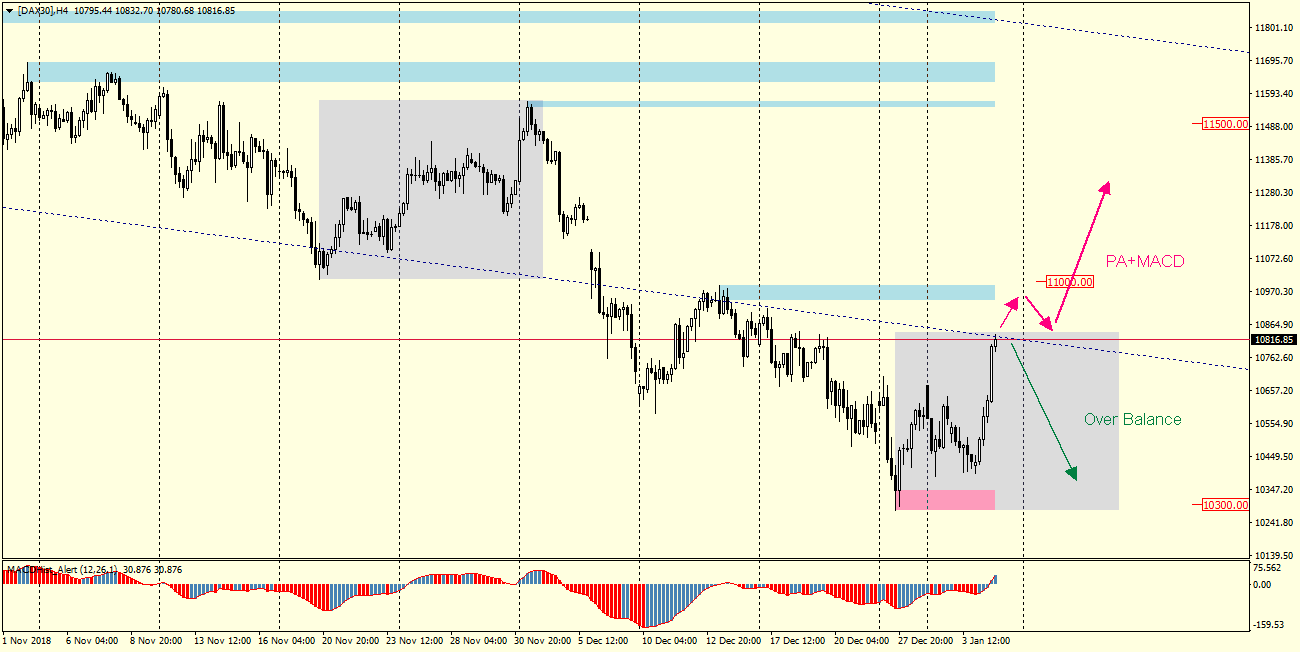
The assumptions of the OverBalance strategy are extremely simple and objective: it is based on the equality of adjustments in a downward trend. The H4 chart shows two equal adjustments in the downward trend (grey rectangles), we are currently witnessing the end of the second adjustment and according to the OB strategy – DAX30 should return to declines. Deciding a SELL order, we open it at the level of 10820 and secure it with the Stop Loss above the nearest supply zone (blue), i.e. around 11000.
And which variant will work? I bet on growths, and what the market will decide we will see in a few days because the analysis belongs to the cycle “When Theory meets Practice” and according to the assumptions of the cycle is verified at the weekend.


 Review")


