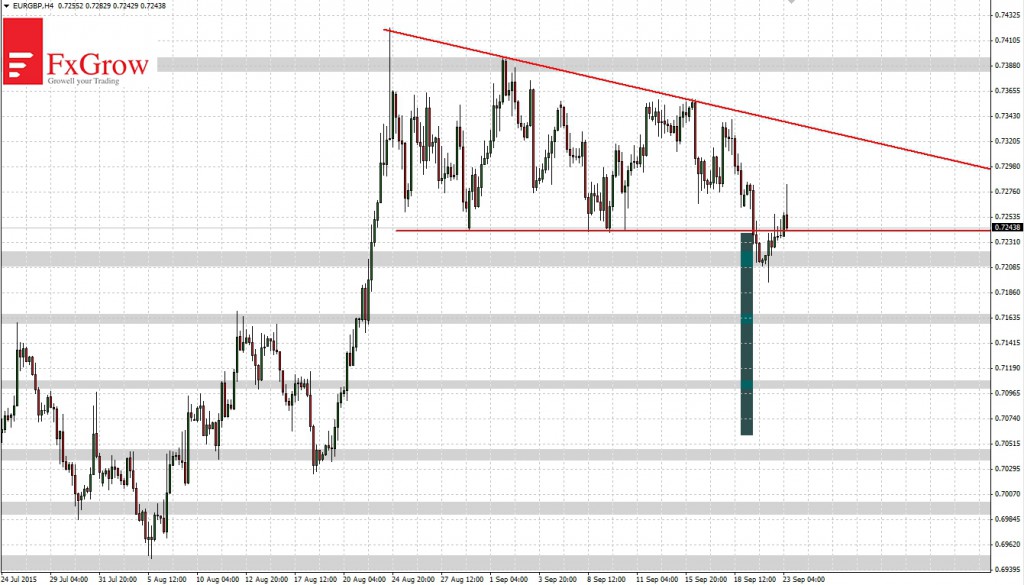
For a month EURGBP moves in a shape of downward triangle. This formation promises falls and it is in line with long-term downward trend. On Monday there was a break below of the triangle after a longer test of the level 0.7240. Support came to help bulls, which is located at the 0.7210 level.
There was a rebound and return to the interior of the triangle. If the rebound will be successful it may test level 0.7340, which is the top of the triangle. However, if in the near future the bulls will press harder break below the triangle will become a fact. Range of the falls will be equal to the height of formation. The target level after breaking the triangle will be 0.7060. Before that, supply will have to deal with more supports: 0.7210, 0.7160, 0.7100, 07040. Alternatively, if the triangle has been break above a nearest resistance is 0.7390.


