System Description
System Details
- The appearance of one of these patterns:
- Retracement measured by “Fibonacci Measurement”:
- Retracement: 0.236, 0.382, 0.5, 0.618, 0.786, 0.886;
- Extension: 1.272, 1.5, 1.618, 2.0, 2.618;
- Retracement measured by “Fibonacci Measurement”:
- The direction of the pattern is consistent with the direction of the trend;
- Risk:Reward ratio is at least 3:1;
- Point D of pattern is Price Action candle or formation confirms direction.
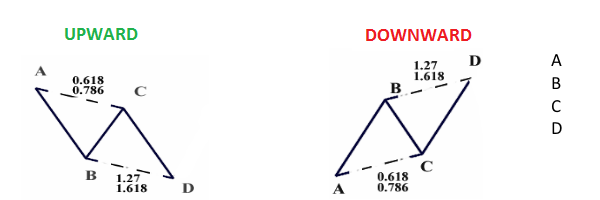
ABCD Pattern
This pattern can occur very often and punctuates every trend. In Elliot Wave theory it is called an ABC correction.
The basic designation is shown below, however points C and D of the pattern can also show up on other Fibonacci levels.
Gartley Pattern
This is the first harmonic formation, which was described by Gartley in 1935.
By measuring retracement of line XA point B must be on 61,8% retracement and point D on 78,6% retracement. Also there should be equality AB=CD.

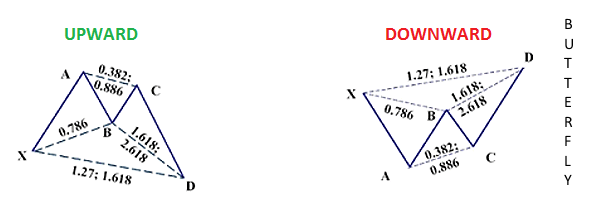
Butterfly Pattern
This is one of the most common patterns due to the fact that point D of pattern can occur on several retracements. Point B must fall on 78.6% retracement of line XA.
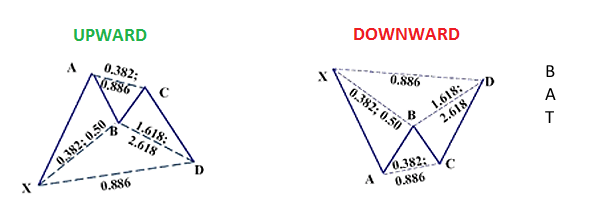
Bat Pattern
Another formation that regularly occurs. Clearly defined is point D, which must fall on the 88.6% retracement of line XA. At the same time point B may fall on certain Fibonacci levels shown below.
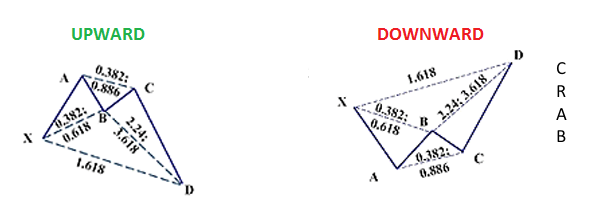
Crab Pattern
This pattern where point D is clearly defined as 161.8% extension of line XA. Point B must be a reversal. It is movable and can be placed between 38.2% and 61.8%.