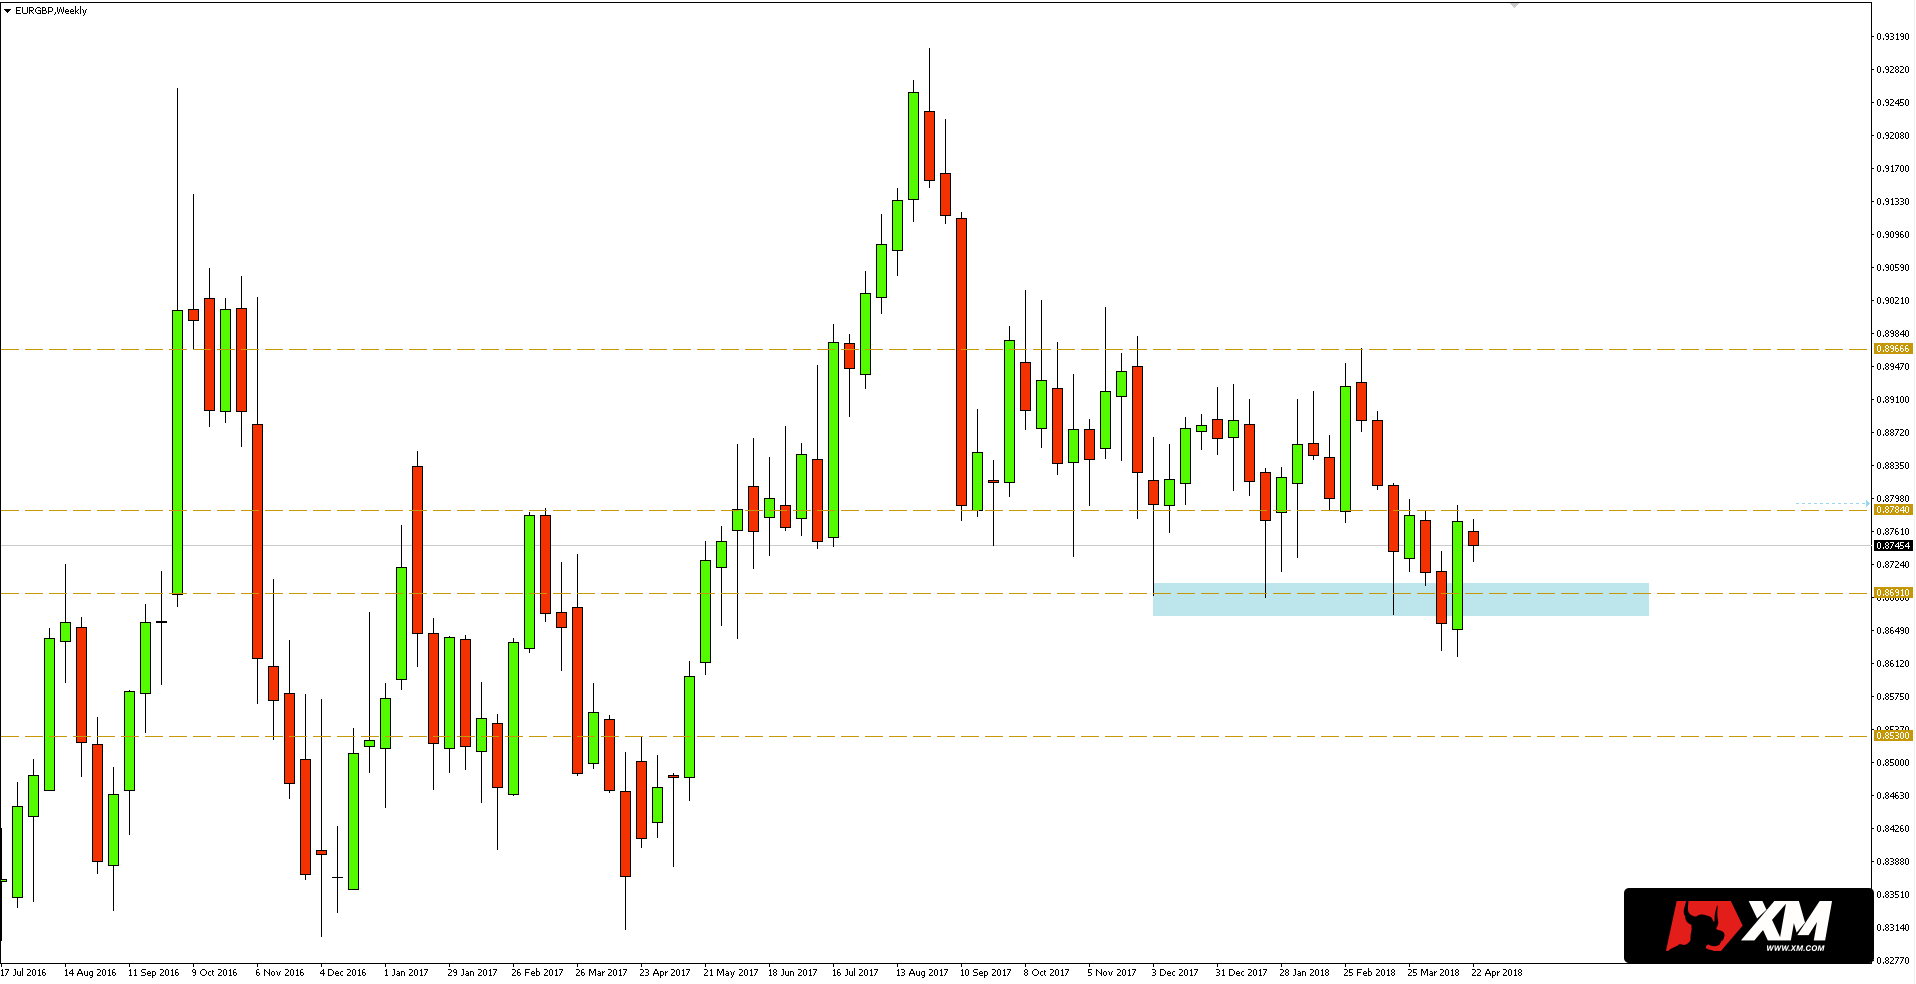
EURGBP two weeks ago closed under the key support area of 0.8691. However, as can be seen on the weekly chart below, the pair grown last week and managed to make up the losses from the previous two weeks, which makes false the earlier break out.
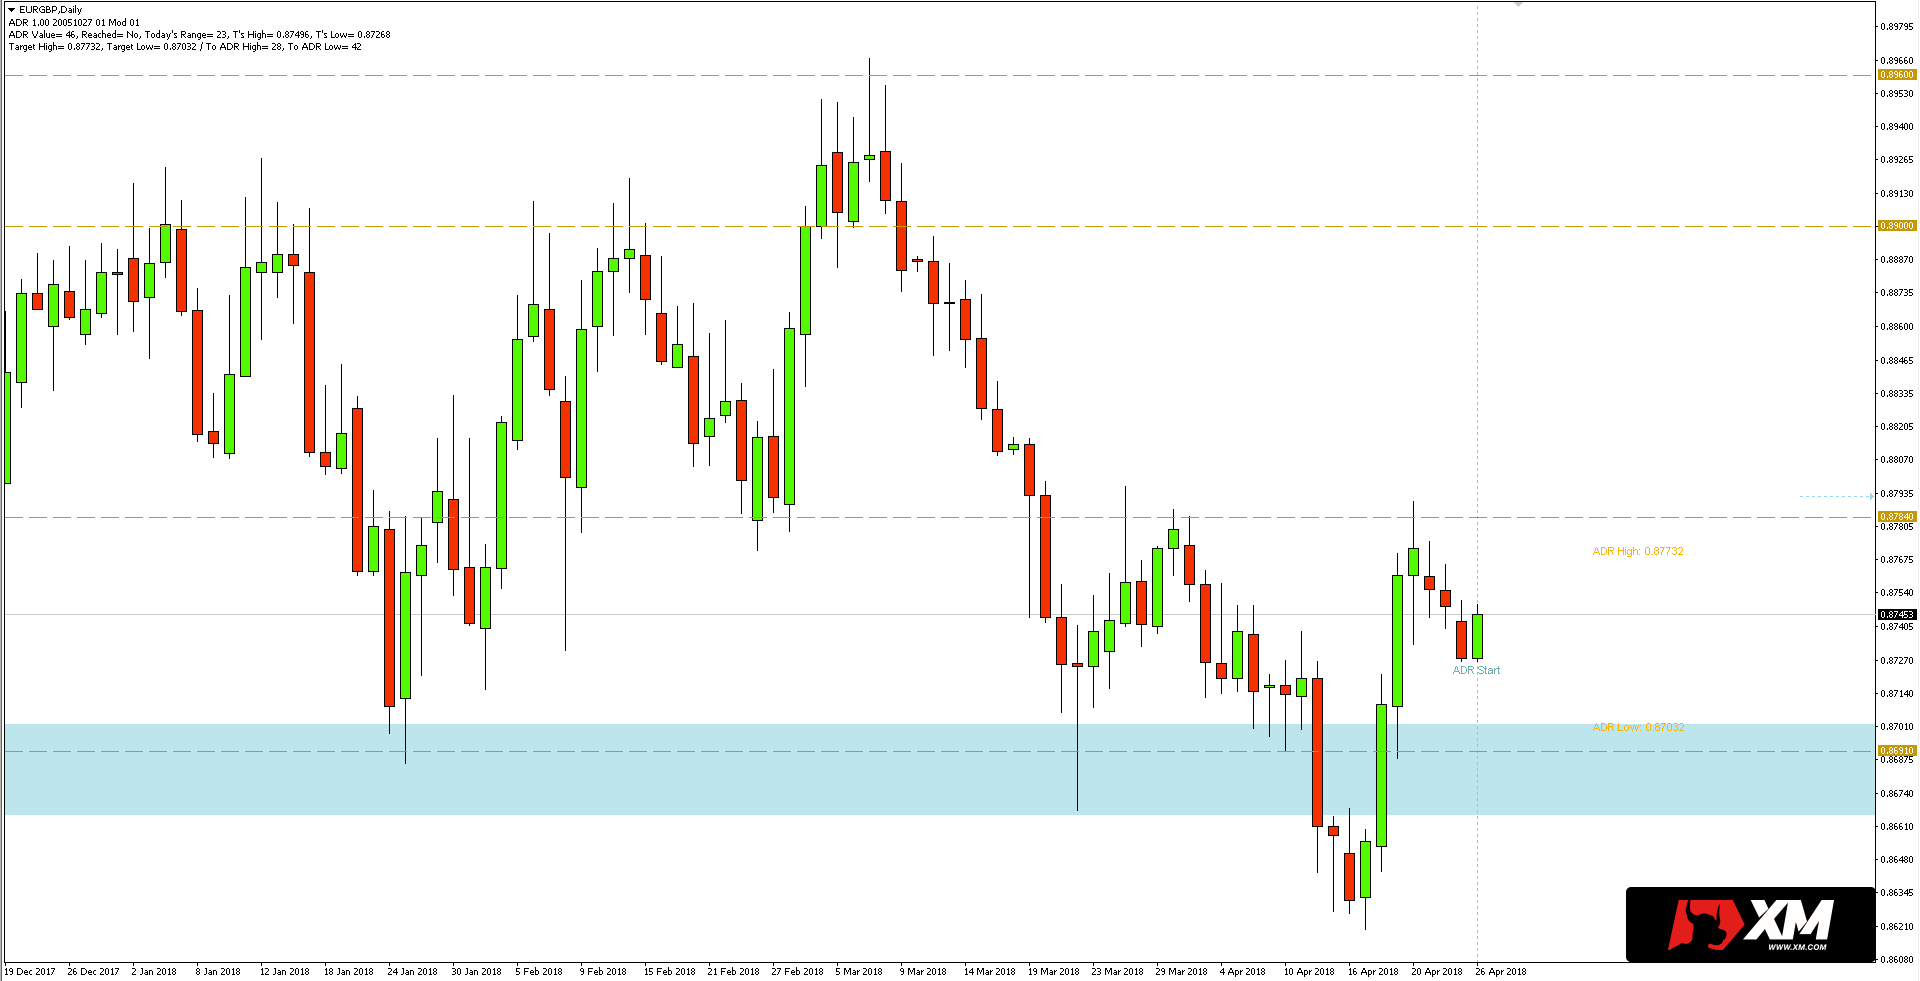
 In turn, the daily chart shows a reaction to resistance at 0.8794. This level was able to stop the further expansion of buyers last week. An interesting situation on the chart may arise at the moment of effective breaking down of the abovementioned resistance. Then the road to the key resistance zone located at 0.8900 / 60 would be open. Alternatively, the breaking of the new minimum will expose pair to further declines.


 Review")


