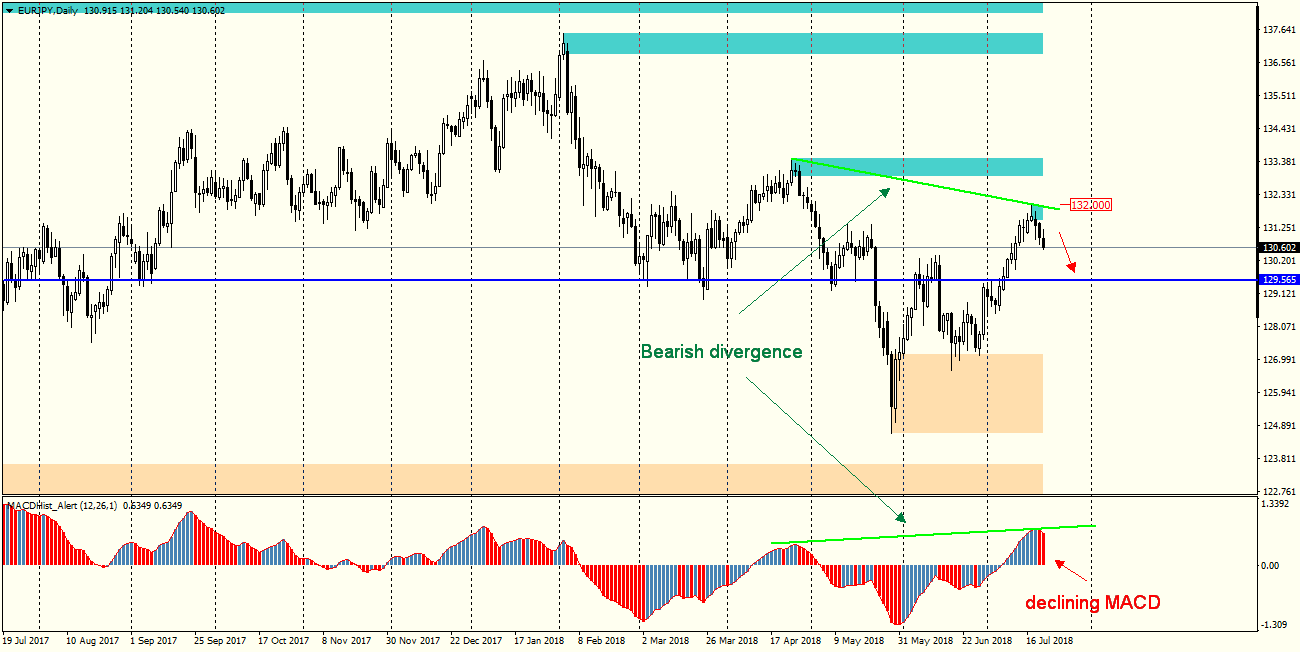
Since the end of June the pair has been moving in an upward trend and at that time made 430p in a northerly direction. The price has been falling for the last three days and a clear downward divergence has occurred between the MACD and price graph. Also, the MACD oscillator has created a maximum and its value is now decreasing, which supports the downward scenario.
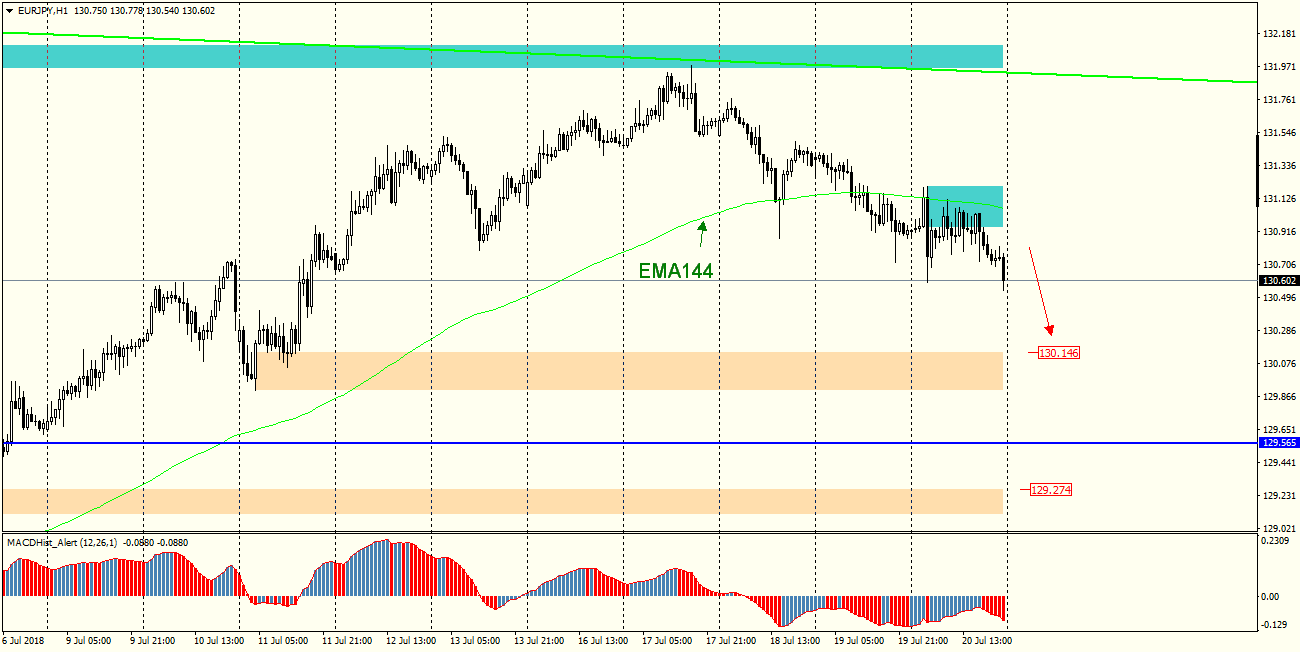
Going to H1 chart, we will notice that in the vicinity of 130.15 there may be a first demand response, and in case of overcoming this zone, the price may go down to 129.30.
Looking at the graph from the point of view of the EMA144 strategy we can see that the pair is under the average EMA144, which is the dynamic resistance level here. Only its breaking through can change the market’s attitude toward bullish and return to growth.


 Review")


