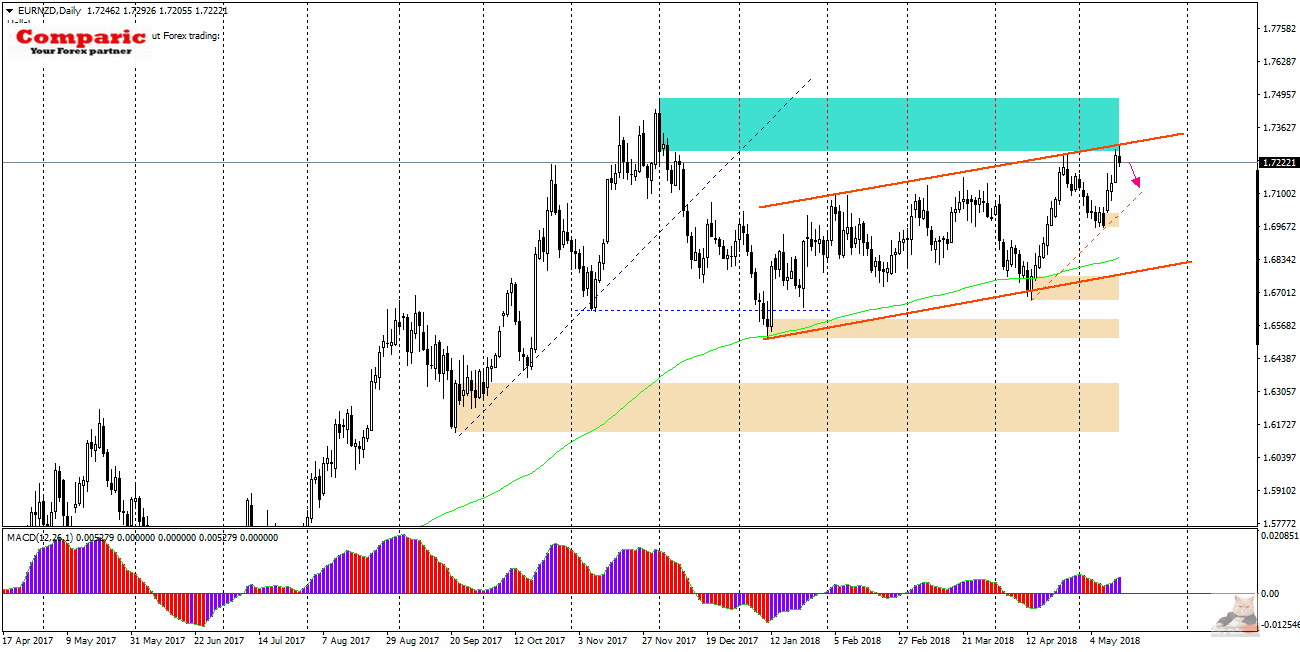
EURNZD has been moving in the bullish channel with a small inclination since the beginning of the year and a range of about 550 pips. Today, the price has reached the upper limit of this channel reaching the level of 1.7290.
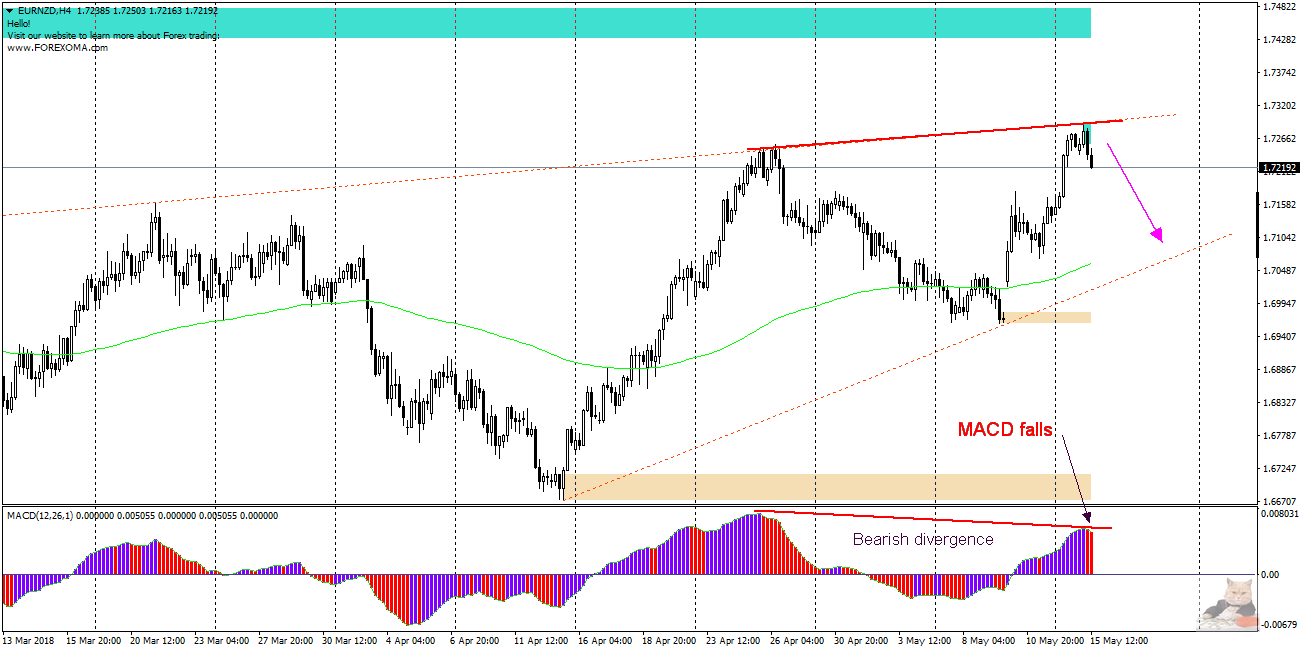
On the H4 chart below, the value of the MACD indicator set the local maximum and starts to decrease (change in color to red). The divergence between the price and the MACD oscillator has arisen which, according to the assumptions of the PA+MACD strategy, predicts declines. If this scenario is implemented, the closest support level is in the vicinity of the trend line (dotted red). If, however, the market decided to break out from the channel, the nearest goal may be resistance at the level of 1.7430.


 Review")


