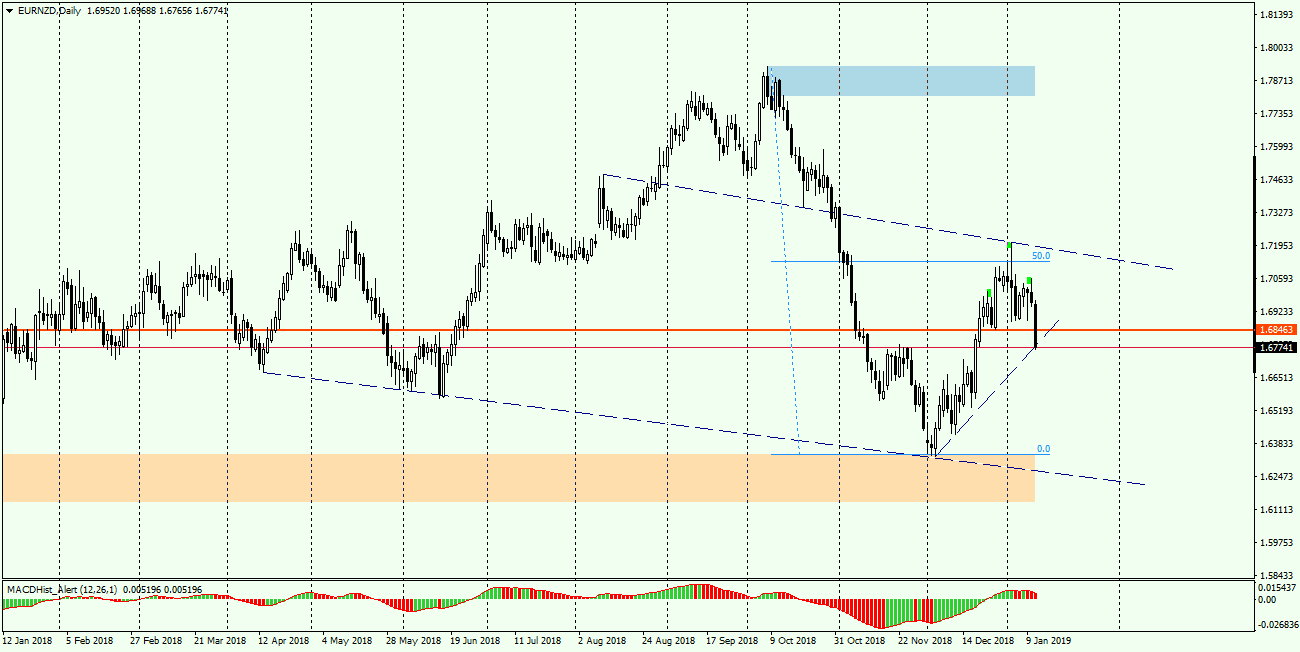
The EURNZD has been moving in a downward trend since 8 October, when it set a maximum of 1.7920. At the beginning of December, an upward correction started, which stopped when it reached 50% of the downward impulse (chart below). The day candle with a long upper wick signalled the weakening of demand and the end of the correction.
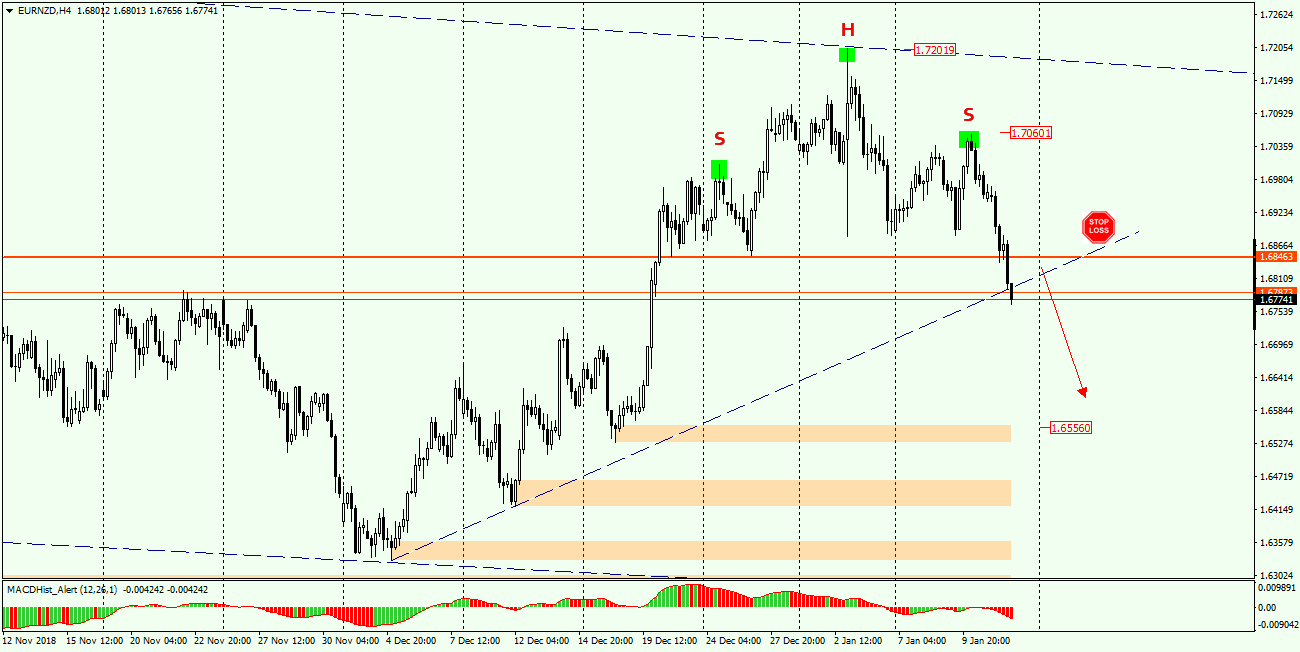
On chart H4 ( below) the Head and Shoulders formation was formed, the neckline at the level of 1.6846 has already been defeated. In addition, the trend line leading through the December lows (5 and 12) was also defeated, which may indicate further declines. The target for supply may be the nearest demand zone starting at the level of 1.6556. For Sell orders, Stop Loss should be located above the neckline and above the last minimum of 1.6885.
Next week on 19th January we plan a webinary for traders, members of our Facebook group. On our group is a poll, if interested ad yourself to attendants. Join us in our new group for serious traders, get fresh analyses and educational stuff here: https://www.facebook.com/groups/328412937935363/
Link to registration to our webinary:
https://webinar.getresponse.com/B5A2/trading-with-macd—strategies-based-on-price-action-and-macd


 Review")


