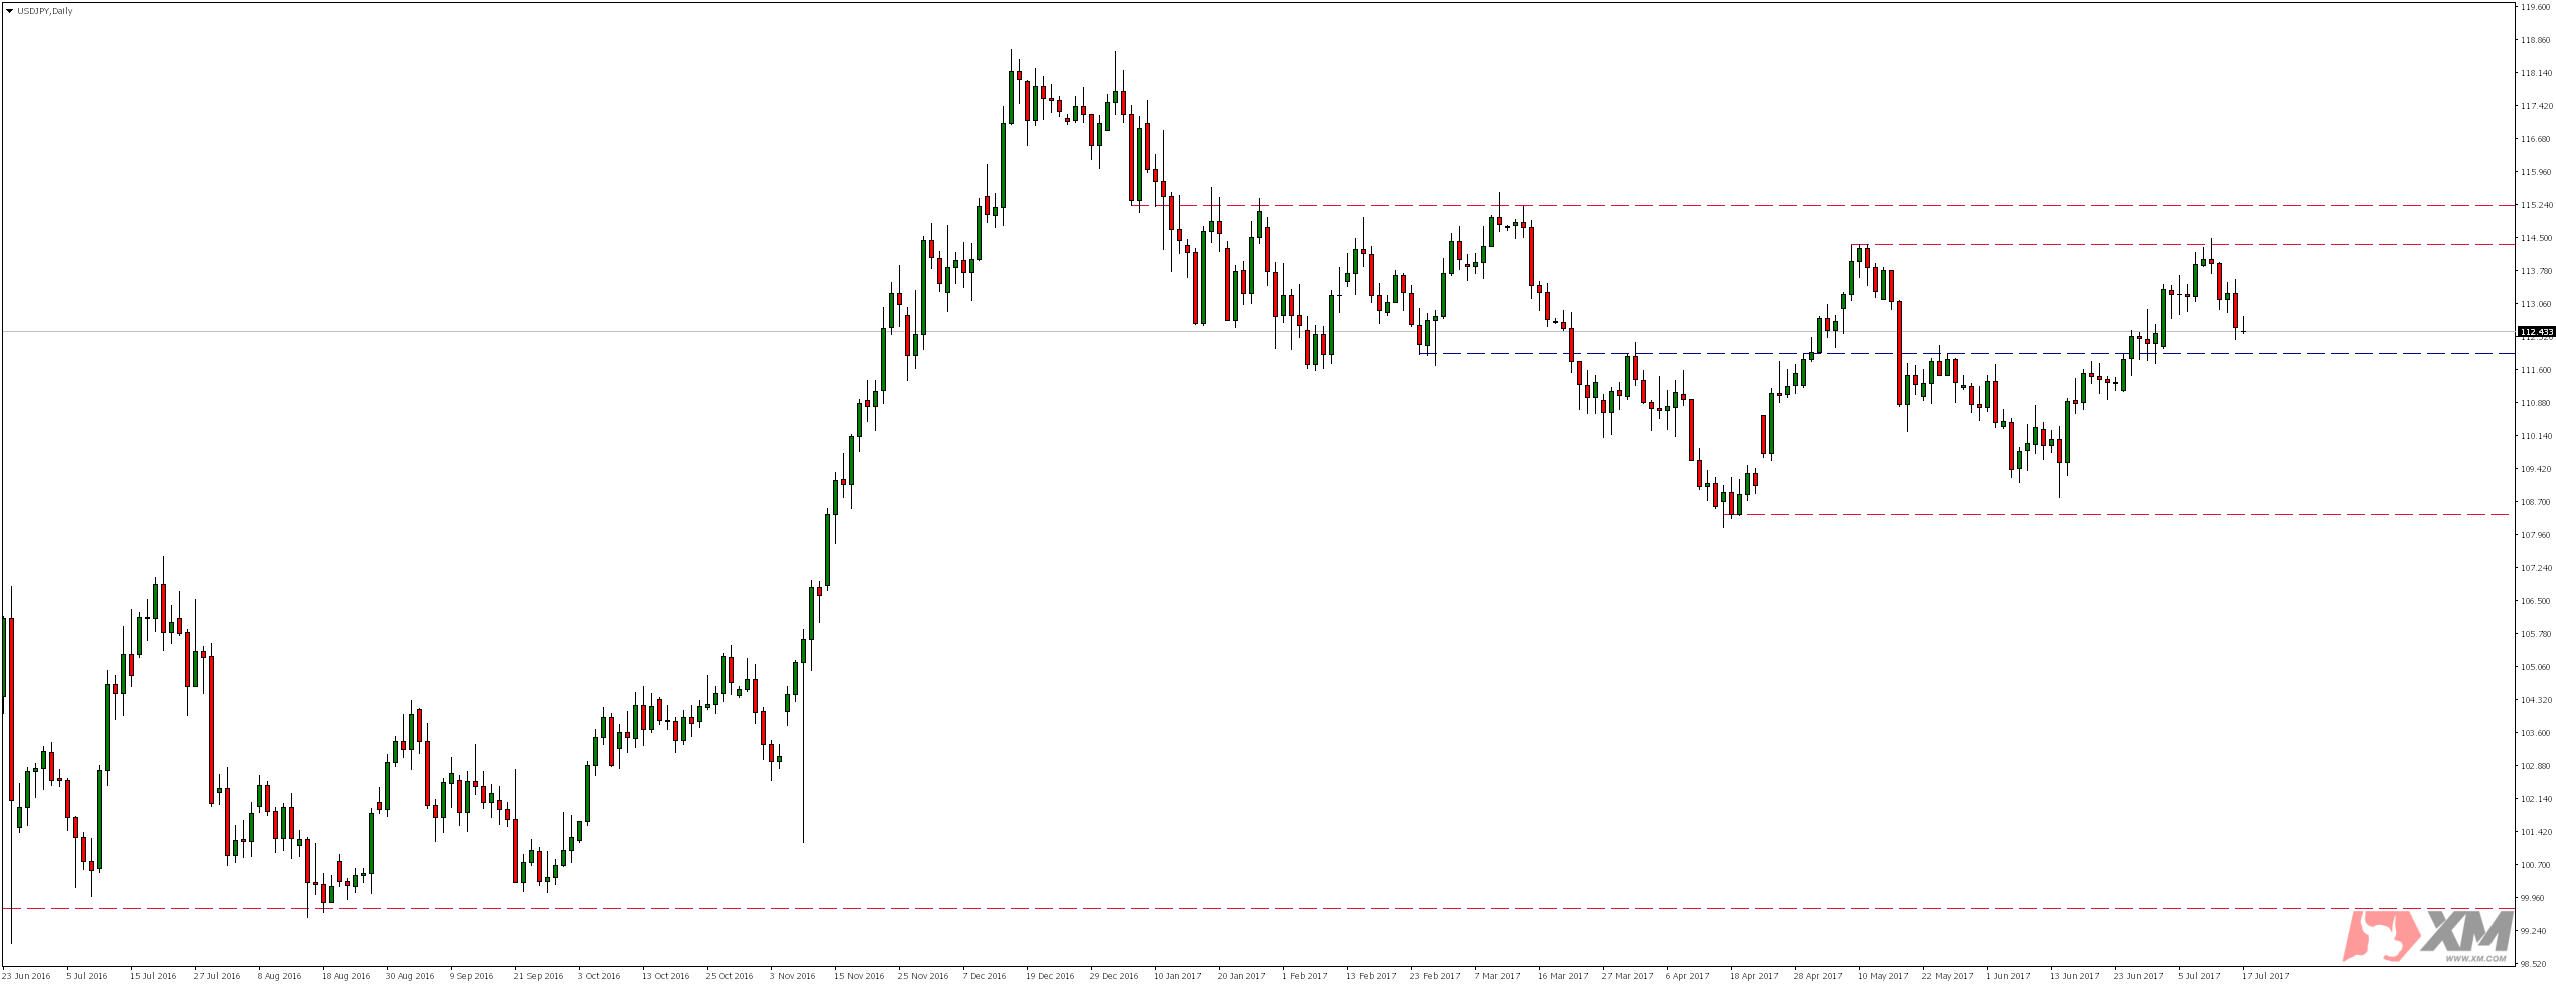
USDJPY since half of March moves in a consolidation. Due to growth lasting from June 15th market reached resistance (upper limit) of the box at 114.40, where last week we saw a supply reaction. Since then, we have been seeing declines again. In near future, we can expect the pair to test again level 112.00, which as we see on the screenshot below, have been tested several times and supply or demand reaction occurred in its neighborhood.
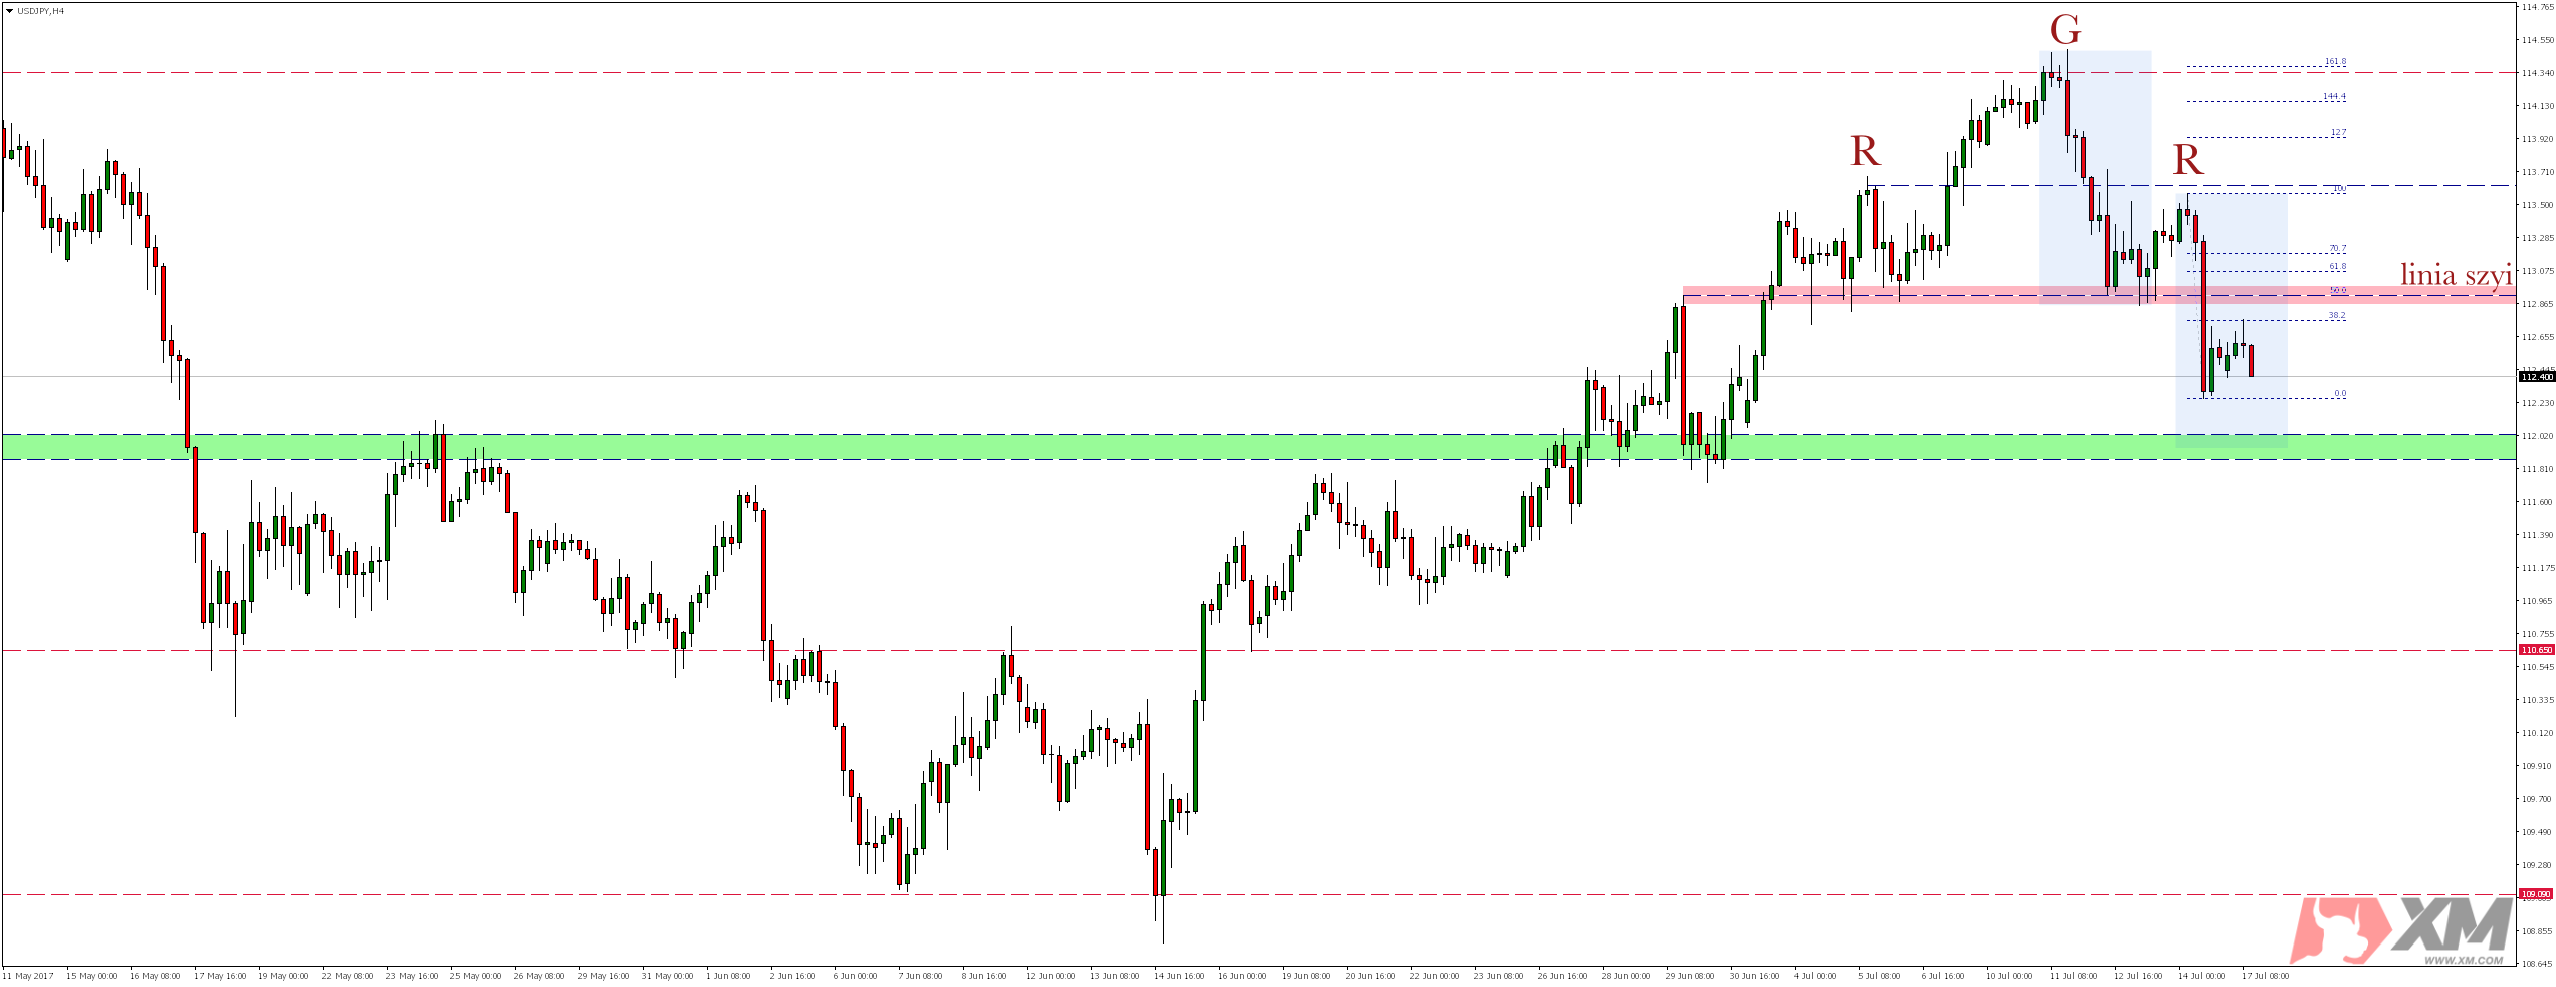
Looking at H4 chart, it is worth noting that a bearish Head & Shoulders formation was built and although neckline which currently coincides with 50% of the Fibo correction still was not re-tested since Friday, when it was broken, currently supply response already occurred in area of 38.2% Fibo measurement and pair returned do declines.
The XM Broker guarantees protection against negative account balances and $ 30 to start!
In the vicinity of earlier mentioned local support now marked as a green zone is a ideal 1:1 proportion from the last bearish impulse, and therefore we would expect there a demand response.
However, if this zone is defeated, further drops could reach levels 110.65 or even 109.09.


 Review")


