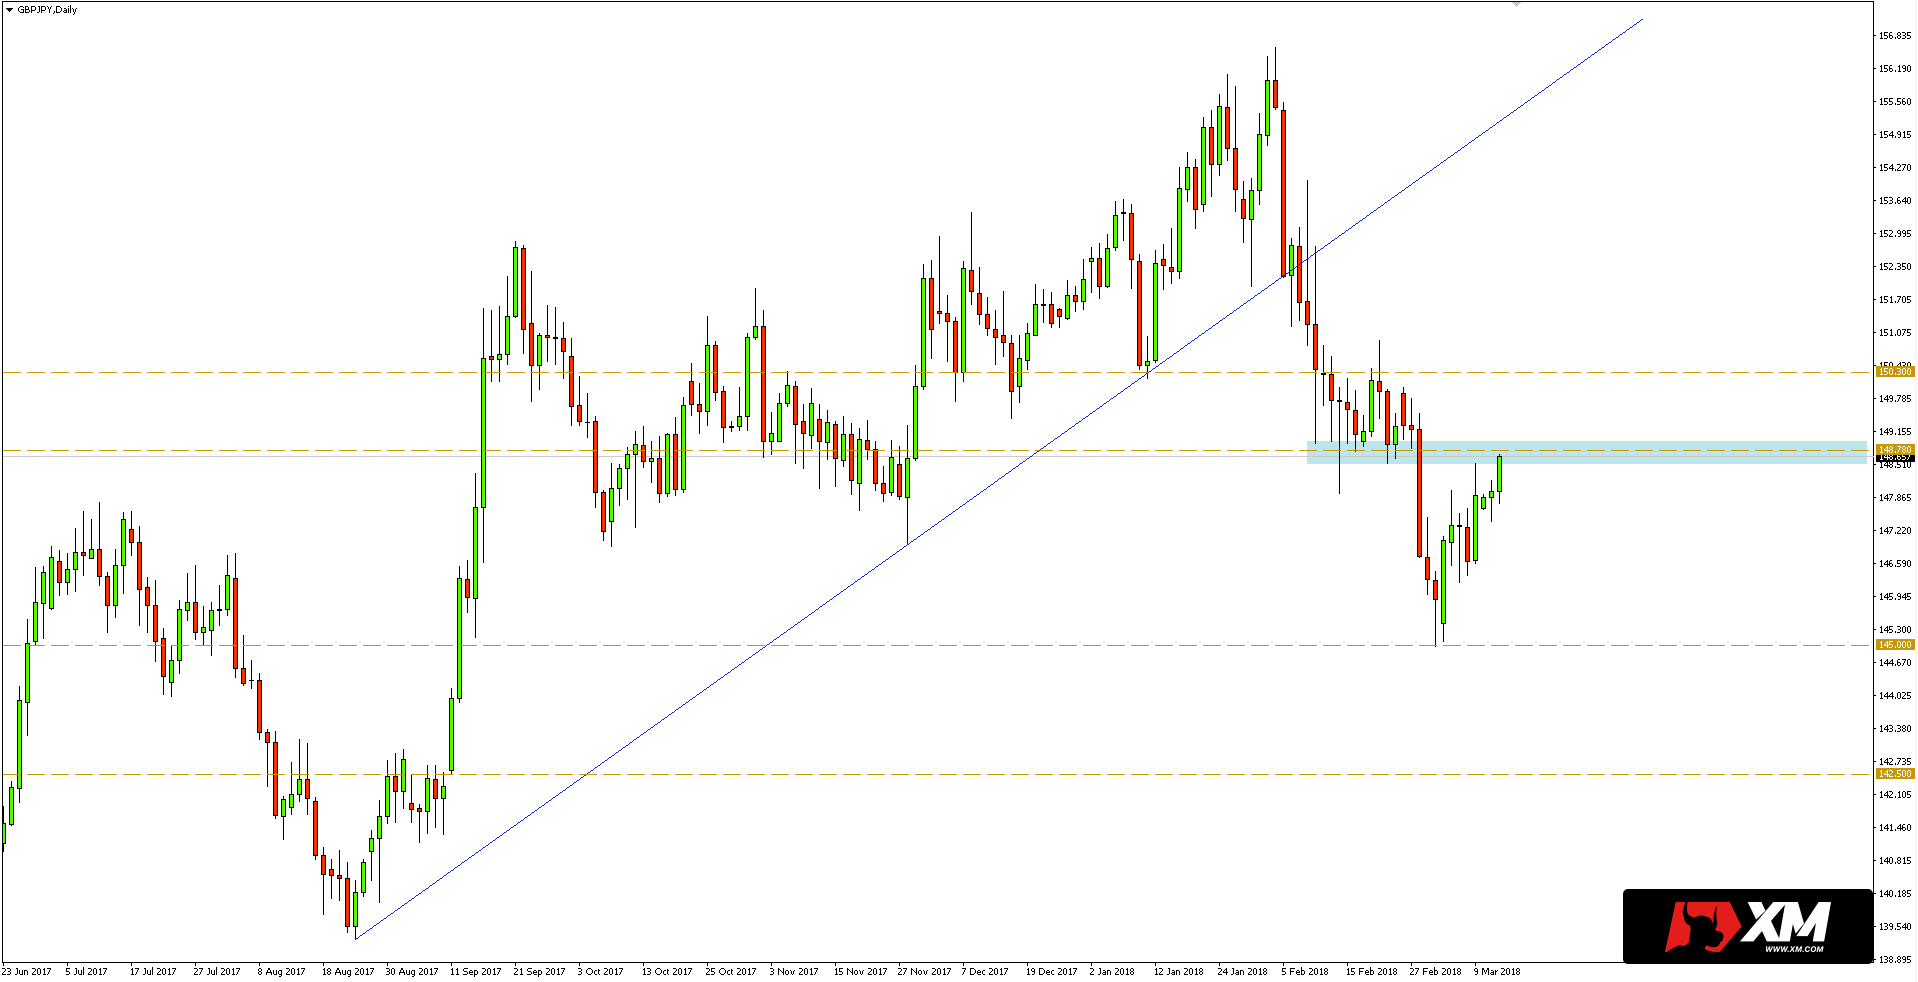
GBPJPY after breaking the trend line from August 2017 changed the direction of to downward trend. The price then dynamically dropped to the area within 148.78, where was supported for several days.
However, as can be seen in the daily chart below, the area was finally defeated, and as a result the pair set a low around 145.00. Since then, we have a rebound and the price has again reached the former support at 148.78, which can now play role of resistance.
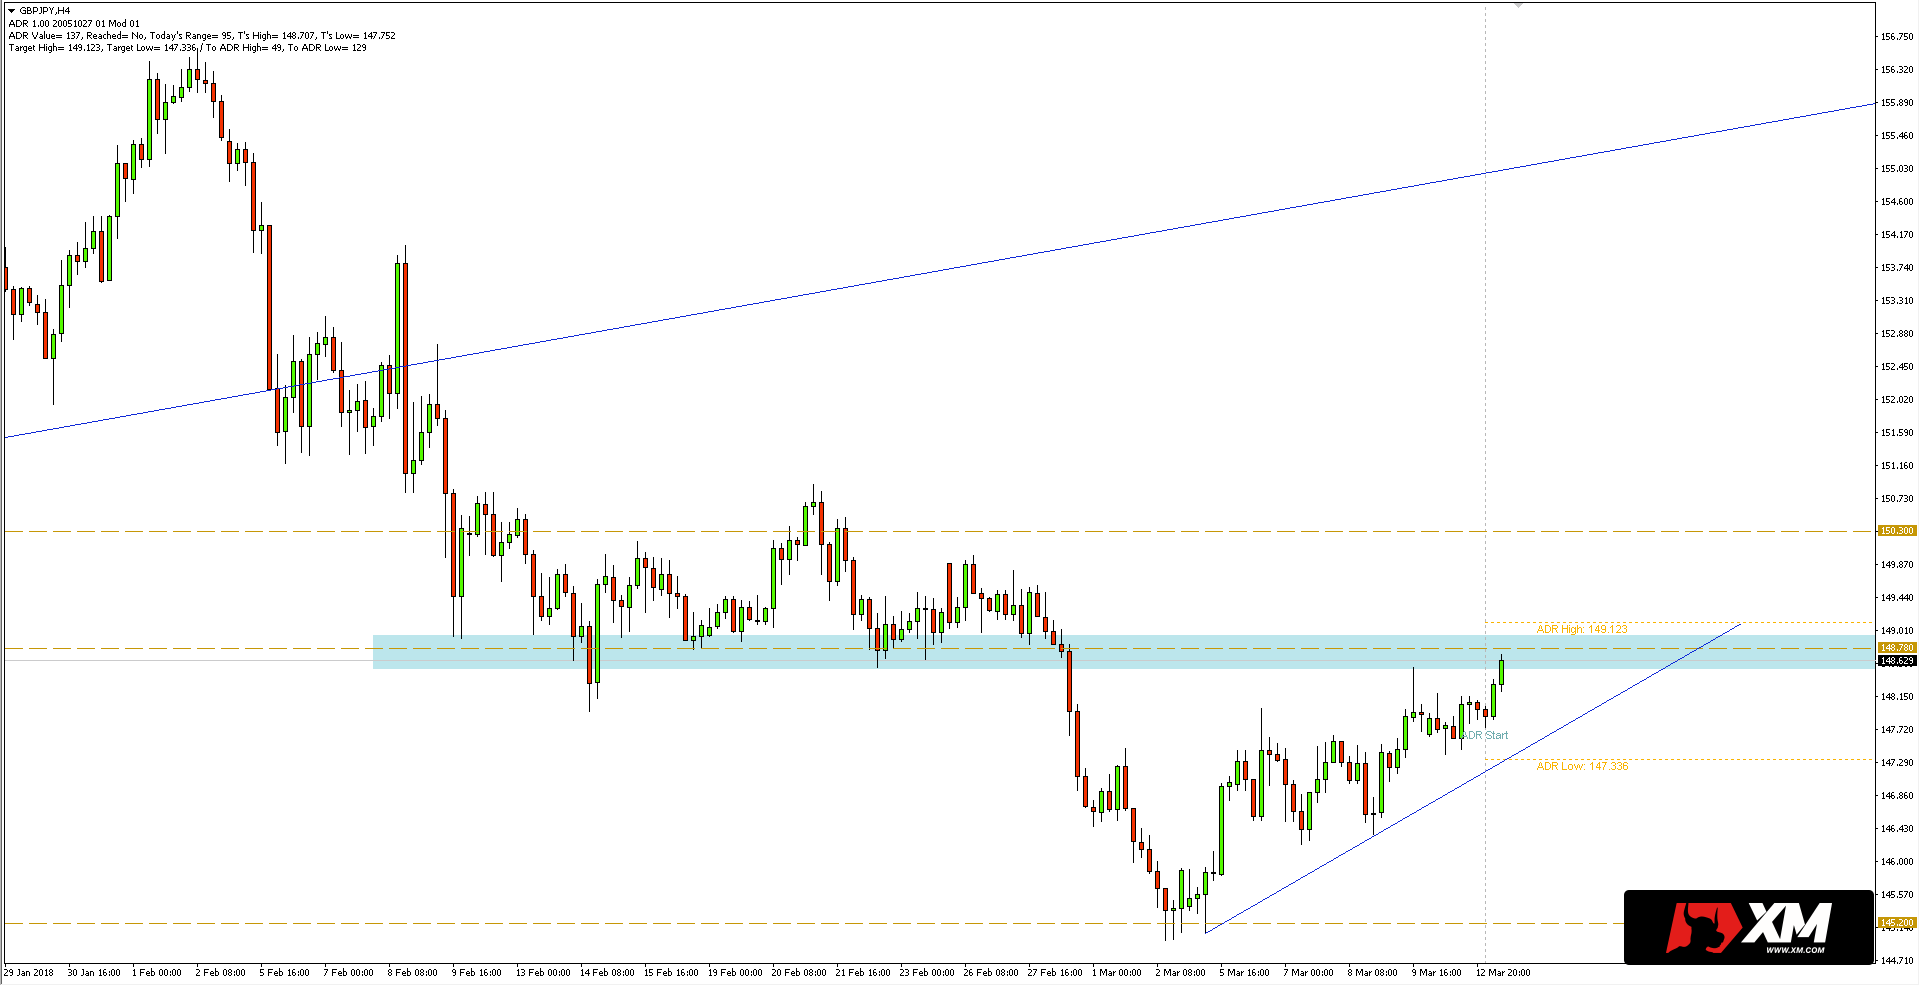
 During today’s session a deeper test of the above mentioned resistance is possible, and slightly above this zone falls the average range that GBPJPY carried out in the last 14 days.
It is possible, therefore, that the resistance test will turn out to be positive, and if the support line running from the third of March 3 is additionally broken, the pair may again go to the level of 145.00.
I trade on this instrument at broker XM, which has in its offer more than 300 other assets >>
Another support after defeating 145.00 is visible around 142.50, from where after the bullish gap was a strong, over 100-pct increase. Alternatively, if the area within 148.70 is broken, the next resistance can be found near 150.30.


 Review")


