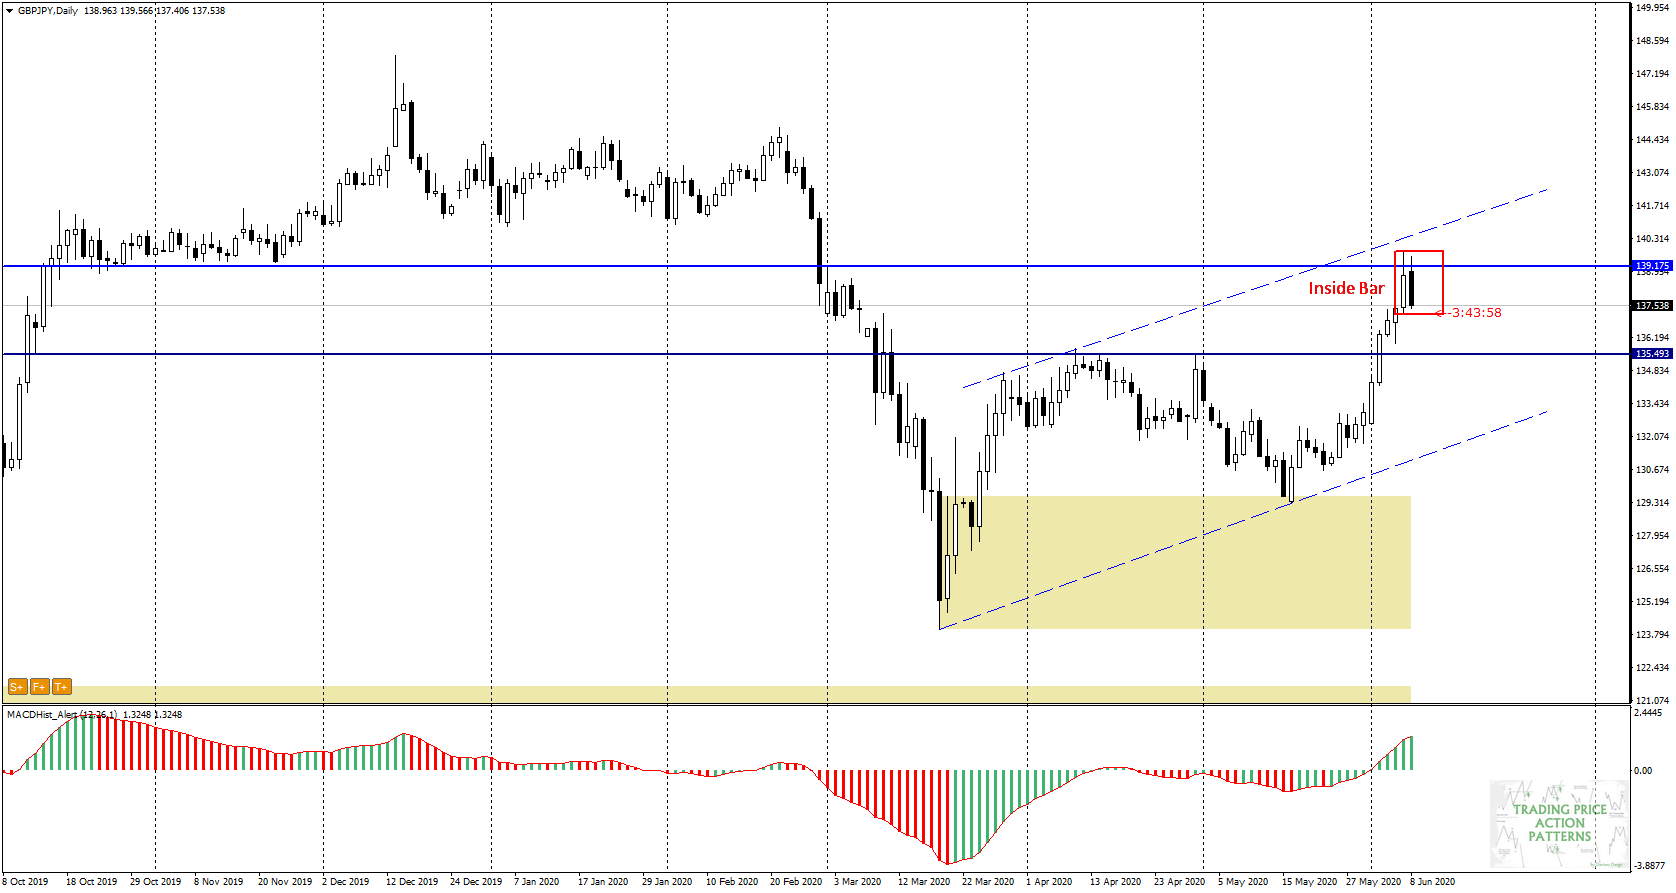
The GBPJPY pair has been moving in an upward trend for the last three weeks. On the daily chart, an Inside Bar formation is formed.
The daily candle from Friday (5 June) which formed this pattern closed below the S/R level at 139.17, signalling the rejection of this resistance. Today’s daily candle 3 hours before closing forms a Inside Bar with Friday’s candle.
Also the situation is interesting on the H4 chart (below). Here, too, an inside bar was formed, which the price has left today in a rather dynamic way.
On the occasion of the breakout from IB a downward divergence was formed on the MACD, which usually confirms that the direction of the breakout remains the same for a few more candles.

In addition, we should note that the next four-hour candle has crossed the local trend line. Declines seem very likely, the supply target may be the nearest demand zone around 136.50. A good level to take a short position will be a possible re-test of the lower edge of IB.
A big support for the bearish scenario would be a maximum on the MACD in the daily chart and the transition of the oscillator to the downward phase.
You can see me trading live every day from Monday to Friday between 1 p.m. and 2 p.m. (London time). During the live sessions I make analysis and show how I trade according to my strategies, I will also answer to your questions in the chat room. All you need to watch my live sessions is enter here: https://www.xm.com/live-player/intermediate
In our Facebook group, which you can join anytime: https://www.facebook.com/groups/328412937935363/ you will find 5 simple strategies on which my trading is based. There, every day we post fresh analyses of currency pairs and commodities


 Review")


