Look at this chart and think about what to do now? Buy or sell?

Do you already know what to do? If you know then you are very lucky. Most investors, including me, have absolutely no idea what to do in a given situation. Statistically, we have a 50% chance that the market will go up or down. The most interesting, however, is that we can still earn on it. Why? Because as we have stated, the market will move up or down. It is certain as the existence of this market because without changing prices the markets are simply dying (as a certain stock exchange has found out, which has tried to introduce fixed prices in the past).
So how do you make money from it? Let’s start with a very simple example. In the place of our last price I draw a horizontal line. Every time the price at the end of the candle is above this line I will open a long position (I will buy) and when the price closes below this line I will open a short position (I will sell). Of course, the price may cut the line several times, initially exposing me to costs, but at some point the price will move further away from my position opening price and regardless of whether it goes down or up, my position will start to generate income. The chart below shows the capital line, i.e. my profits and losses. On the price chart, green arrows indicate buy transactions and red arrows – sell transactions.
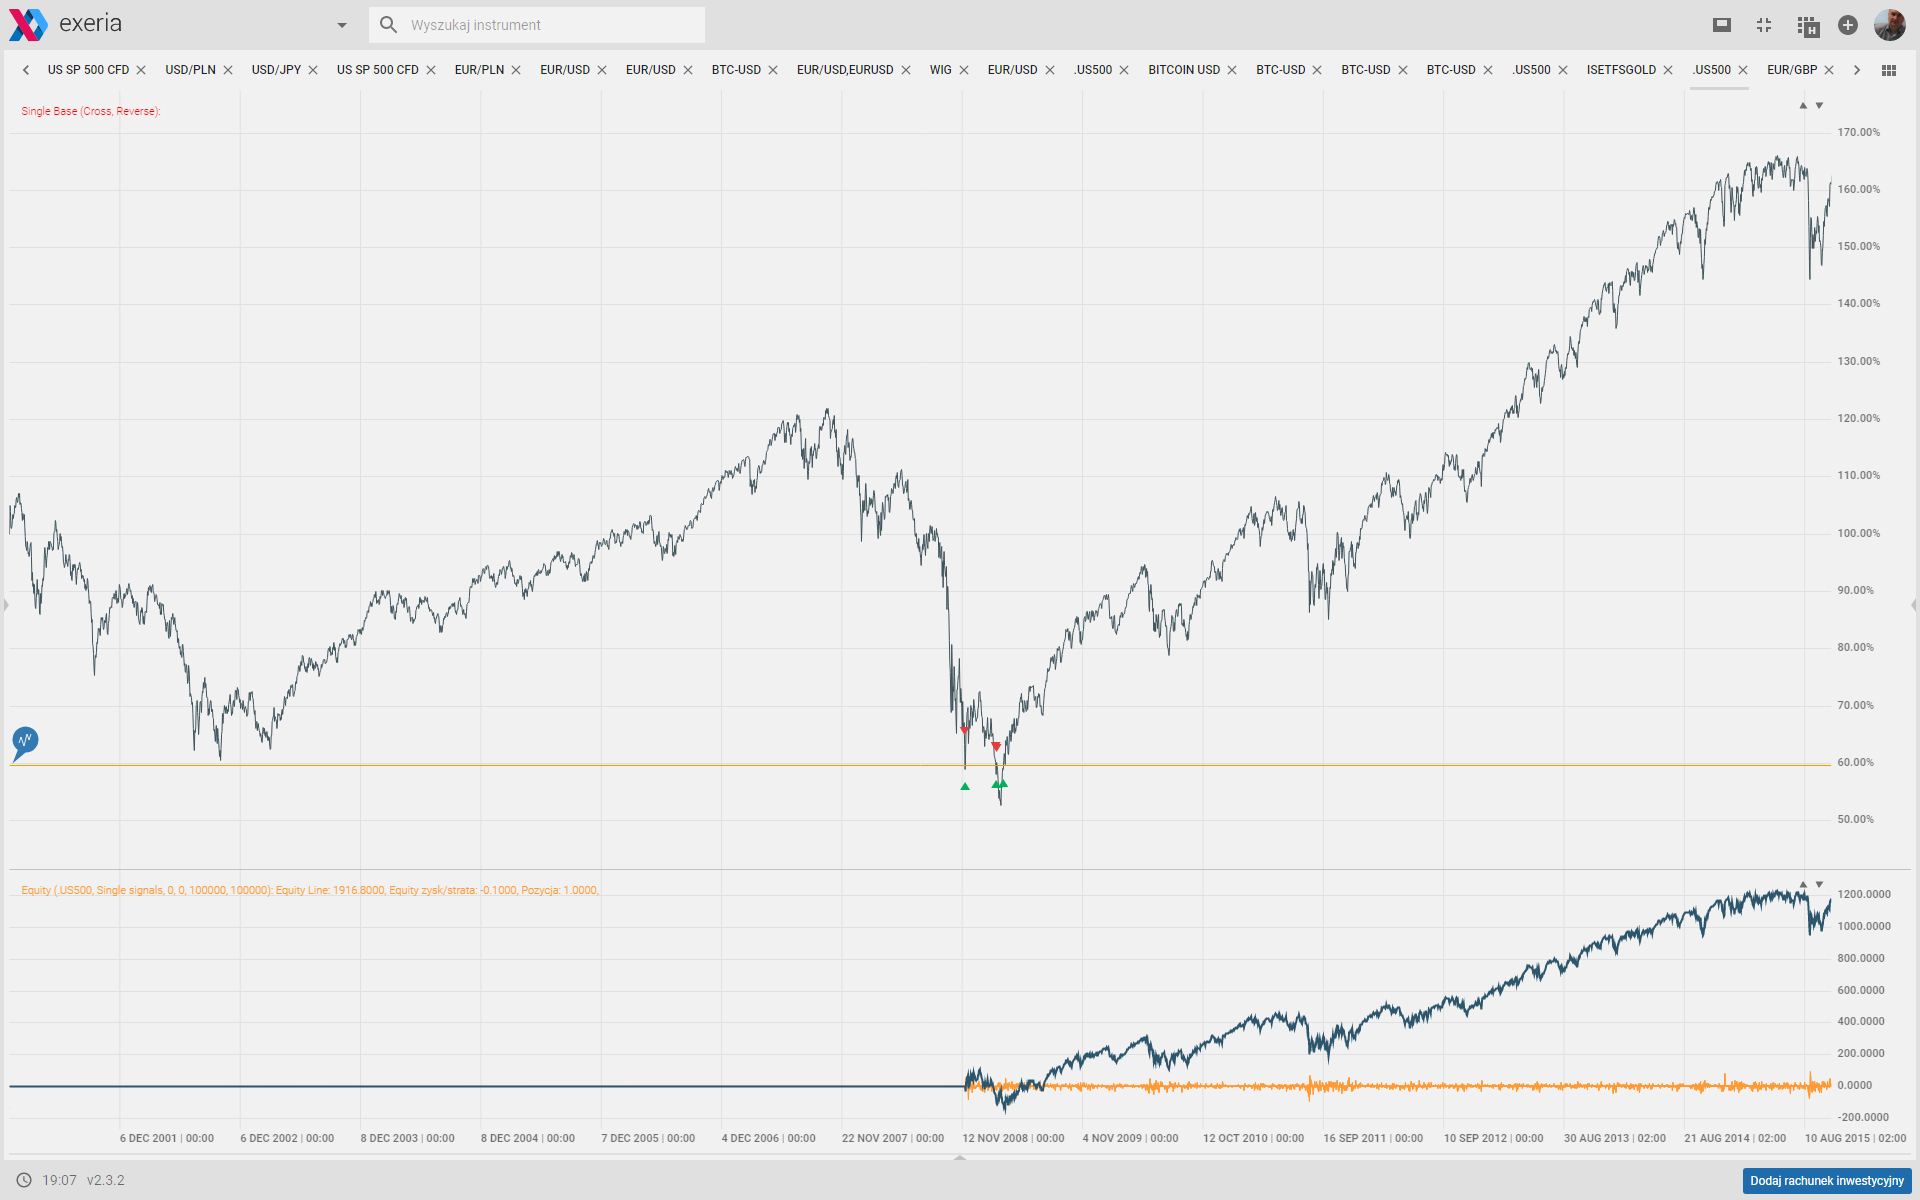
At the beginning I suffer losses on this strategy, but later I start earning. I can easily use this strategy in Exeria, which will automatically monitor the transaction. So I don’t have to spend my precious time observing boring prices.
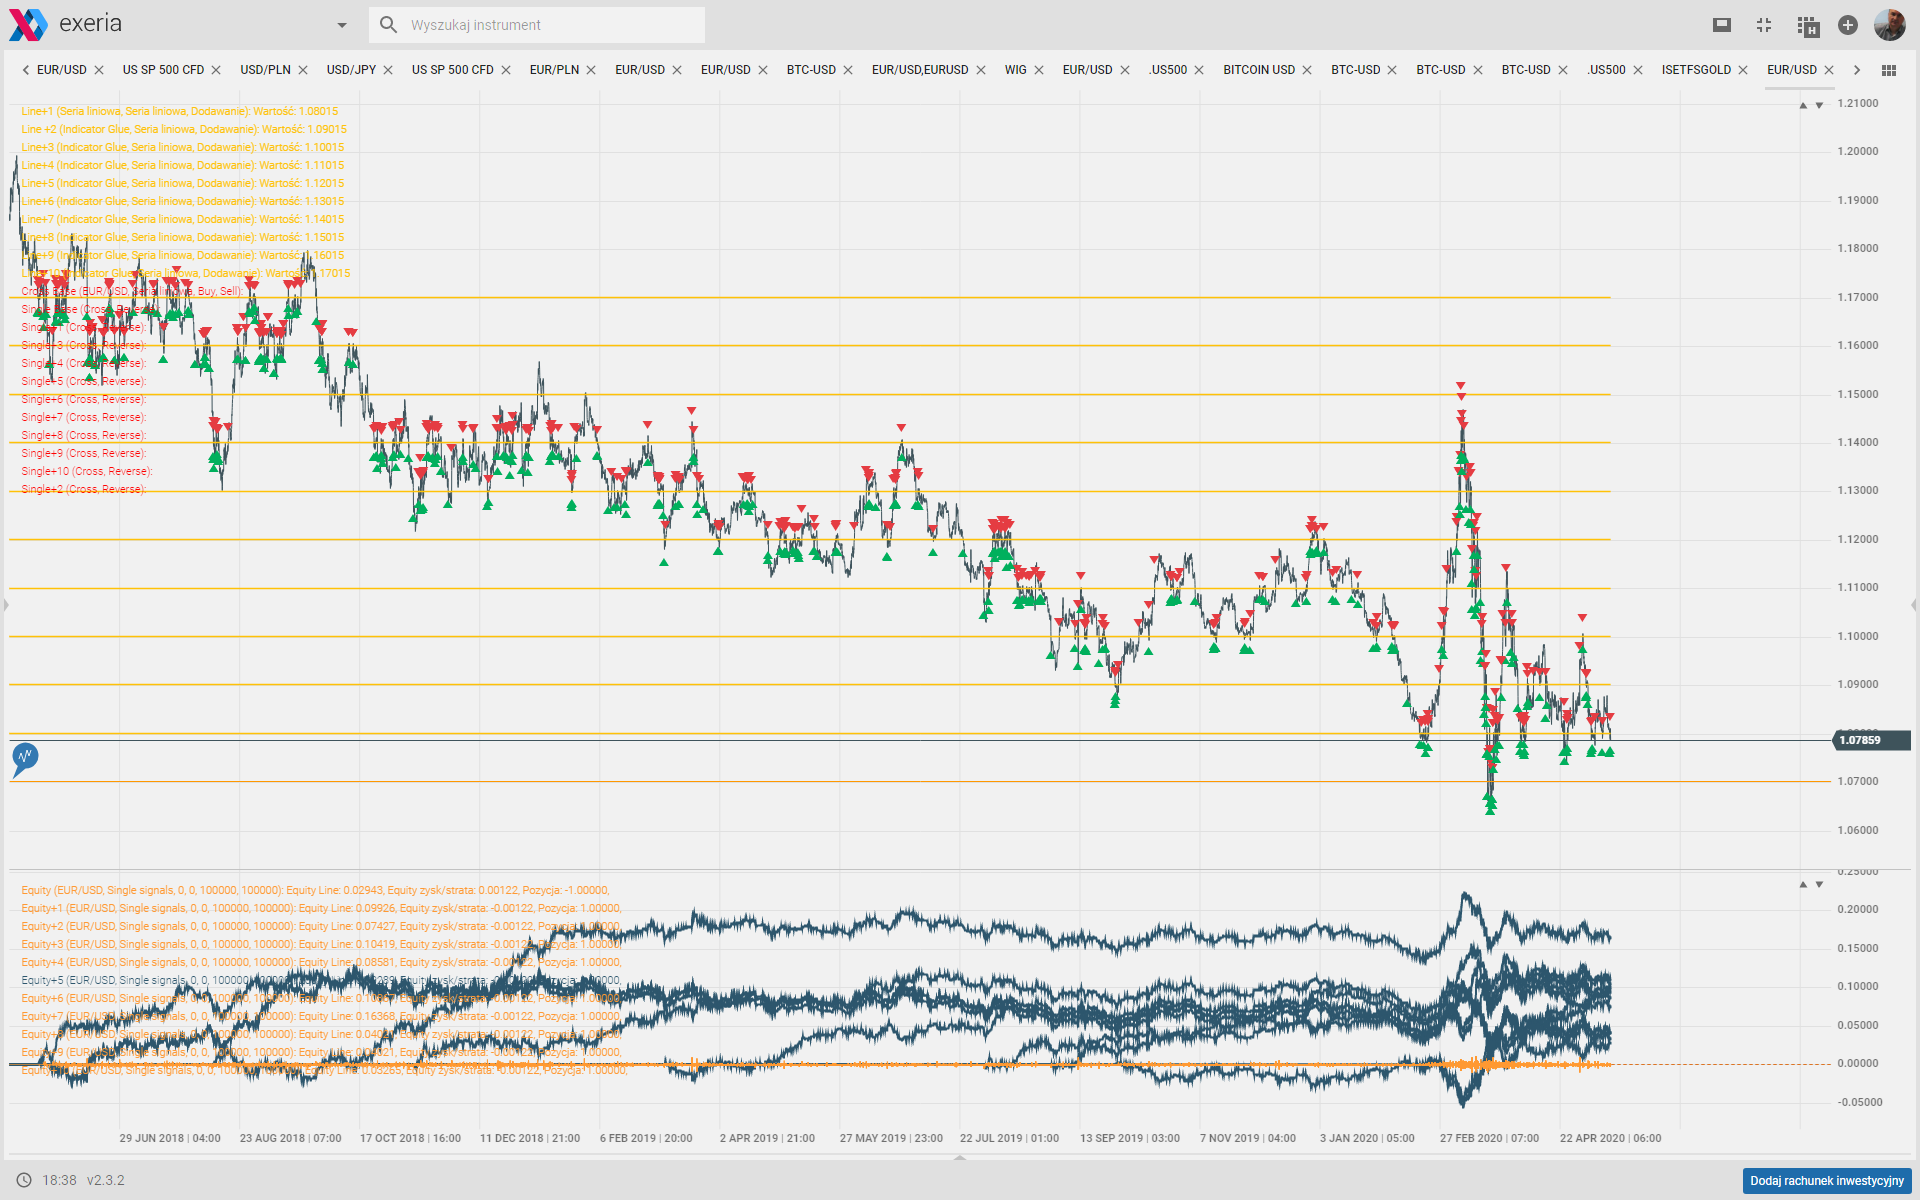
Do you fancy more? The above strategy should be used in markets with clear trends – e.g. the stock index shown above. However, there are markets (e.g. currency markets) whose prices are characterized by a return to the average. You have probably noticed the dollar or euro prices jump up and down even though they have been relatively stable for years. In such markets, we can use exactly the opposite strategy. What’s more, we can expand it and create more horizontal lines. See how it might look like in the chart below. At the bottom of this chart are the capital lines (gains and losses) for each level.
You can’t predict prices yourself? Most investors can’t do it well. Still want to earn money on price changes? Use algorithmic trading and automation.
Tomasz Korecki


 Review")


