GBPJPY 2019/02/06

I wrote about GBPJPY on the last day of January, when an Inside Bar appeared announcing the declines. However, the expected range of falls did not entirely work out, from at least 200p planned it stood at 70p and then the price returned. The change of direction was probably influenced by the good results of payrolls because just after the publication of these data, the price suddenly reversed. Looking at chart D1 we can see that this week promises declines, as evidenced by Monday’s PinBar and today’s day candle, which created the maximum on MACD (oscillator started declining).
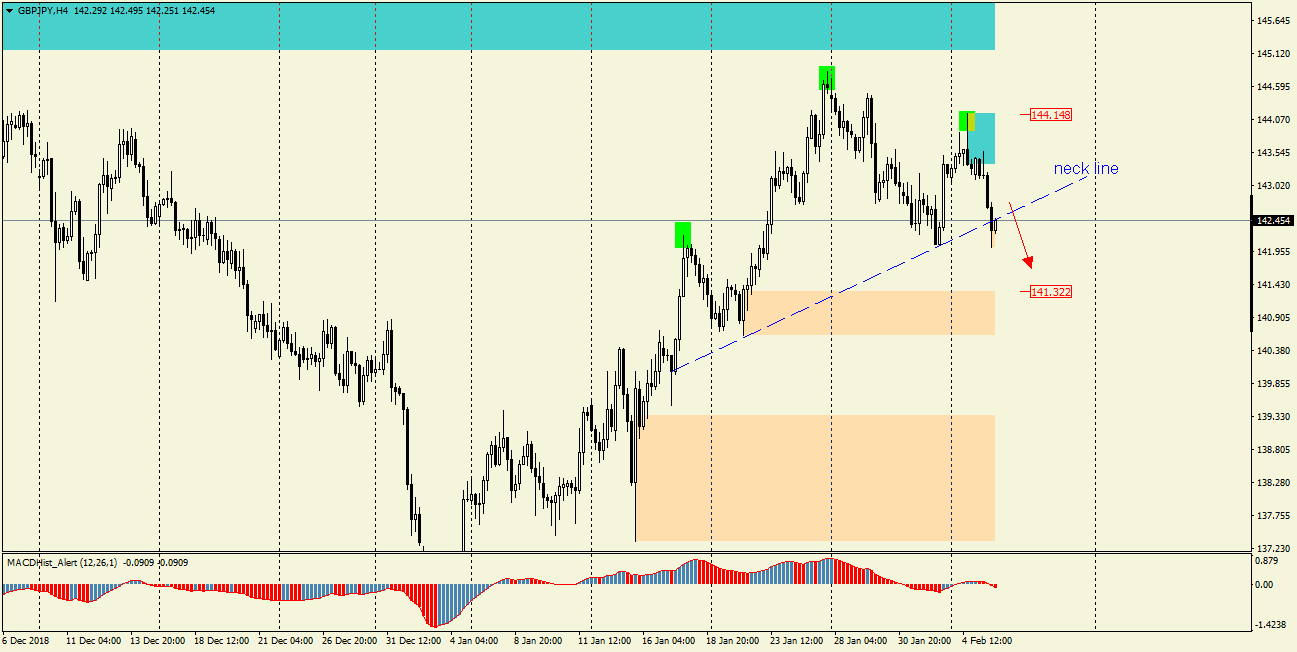
In addition, the chart H4 can also see the Head and Shoulders formation, admittedly slightly slanted…. However, all levels seem to meet the conditions for this type of formation. The neckline has been defeated and the price is currently oscillating near it. The closest level of support is about 100p lower, i.e. 141.30-40. If the neckline retest turns out to be effective, you can think of a sell order.
Join us in our new group for serious traders, get fresh analyses and educational stuff here: https://www.facebook.com/groups/328412937935363/


 Review")


