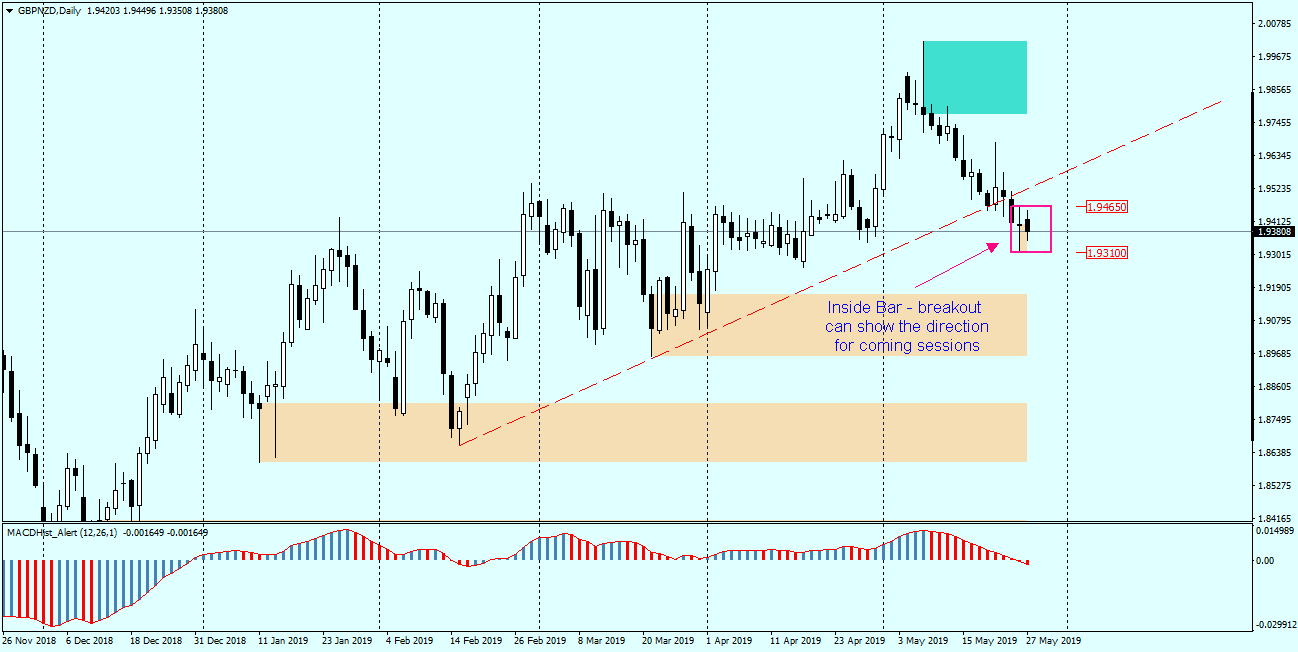
GBPNZD – an instrument with quite high volatility in comparison with other currency pairs, there are daily candles with a range exceeding 400p. Since December last year the quotations have been moving in an upward trend and in the period from 12.12.18 to 07.05.19 the pair gained 1900p. Today’s quotes were moving around the Friday daily candle forming an inside bar formation.
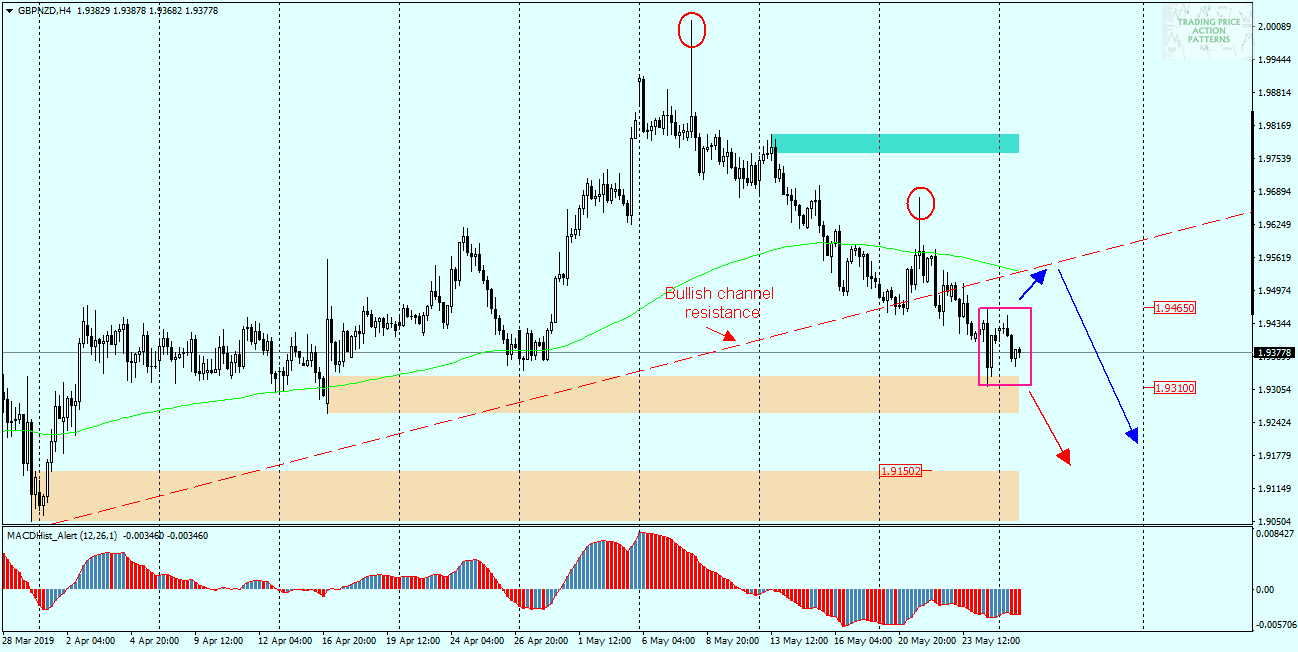
When you look at the H4 chart below, you can consider two scenarios depending on the direction in which the quotes break out of the IB formation.
On the chart I marked an upward scenario – “blue” and a downward scenario – “red”. Bearing in mind that during the recent declines there were two strong bearish pin bars indicating a clear reluctance of the market to increase, the analysed IB will probably turn out to be a formation of continuation of the declines, therefore the “red” scenario seems more likely. Bearing in mind the high volatility of this pair, when placing an order, it is worth reducing the volume by half in order to be able to place a bigger than usual Stop Loss.

 In our Facebook group, which you can join anytime: https://www.facebook.com/groups/328412937935363/ you will find 5 simple strategies on which my trading is based. There, every day we post fresh analyses of currency pairs and commodities


 Review")


