The most frequently used indicators of technical analysis include moving averages. There are several types to choose from, depending on the calculation method. There are four main types of moving averages:
- Simple Moving Average (SMA)
- Exponential Moving Average (EMA),
- Smoothed Moving Average (SMMA) and.
- Weighted (WMA – Weighted Moving Average).
An important parameter when calculating the average values is its period and it can be any natural number. For long term analysis, usually averages with larger periods are used, usually 200, 100 or 50 period averages.
In the GBPUSD daily chart, a 50-period moving average crossed the 200-period average from above, which is often called the “death cross”. This sounds pretty scary, but it is not the name of the phenomenon that we are talking about… more importantly, what it might herald.

The last two such “death crosses” on this pair resulted in large drops. In the first case they were 850p in the second 750p. What is worth noting is that when the opposite situation appeared, i.e. a fast average pierces the slow one from the bottom called the “golden cross”, in case of GBPUSD it worked out and the increases reached 400p and 600p.
This, of course, is quite a long term analysis since it is a day chart analysis, which can take several weeks to complete and is of little use in day trading. However, it is worth keeping it in mind when planning long-term orders.
From Monday to Friday – Live trading at 13:00 (London time) chat, analyse and trade with me: https://www.xm.com/live-player/basic
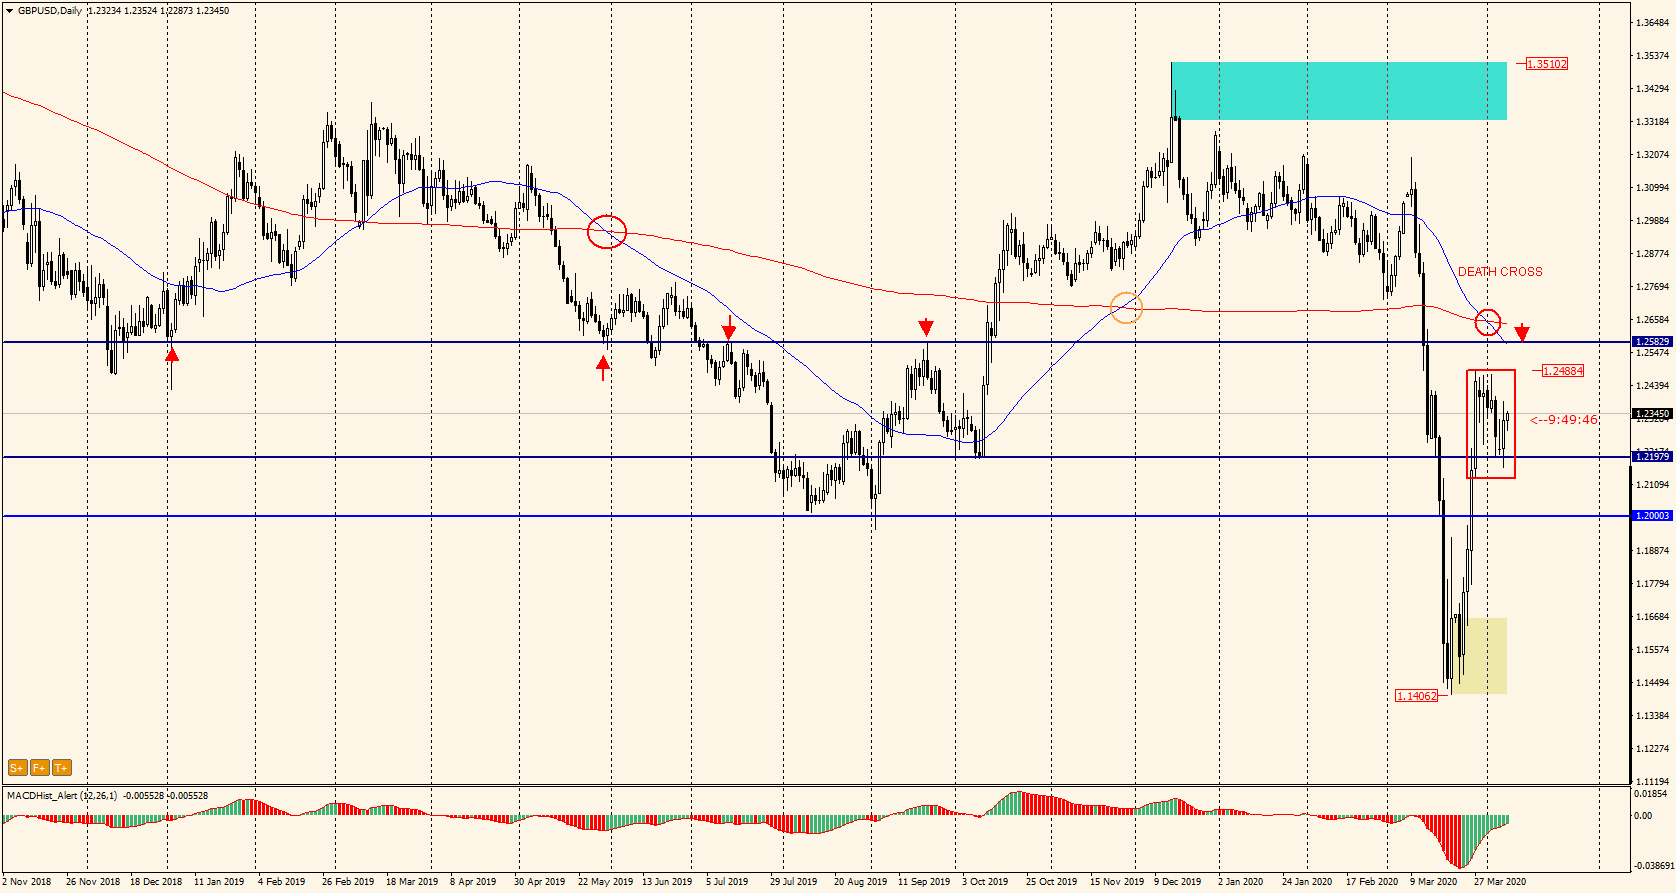
Looking at the daily chart from a closer perspective, a strong level of support and resistance (S/R) 1.2580, which has proven to be respected over the last few years, would be a good place for SELL. But for this to happen, the maximum of March 27th, which is also the upper limit of Inside Bar -1.2488, has to be overcome. Interestingly, this last maximum is at the fibo level of 50% correction of downward movement(1.35-1.14).
In our Facebook group, which you can join anytime: https://www.facebook.com/groups/328412937935363/ you will find 5 simple strategies on which my trading is based. There, every day we post fresh analyses of currency pairs and commodities


 Review")


