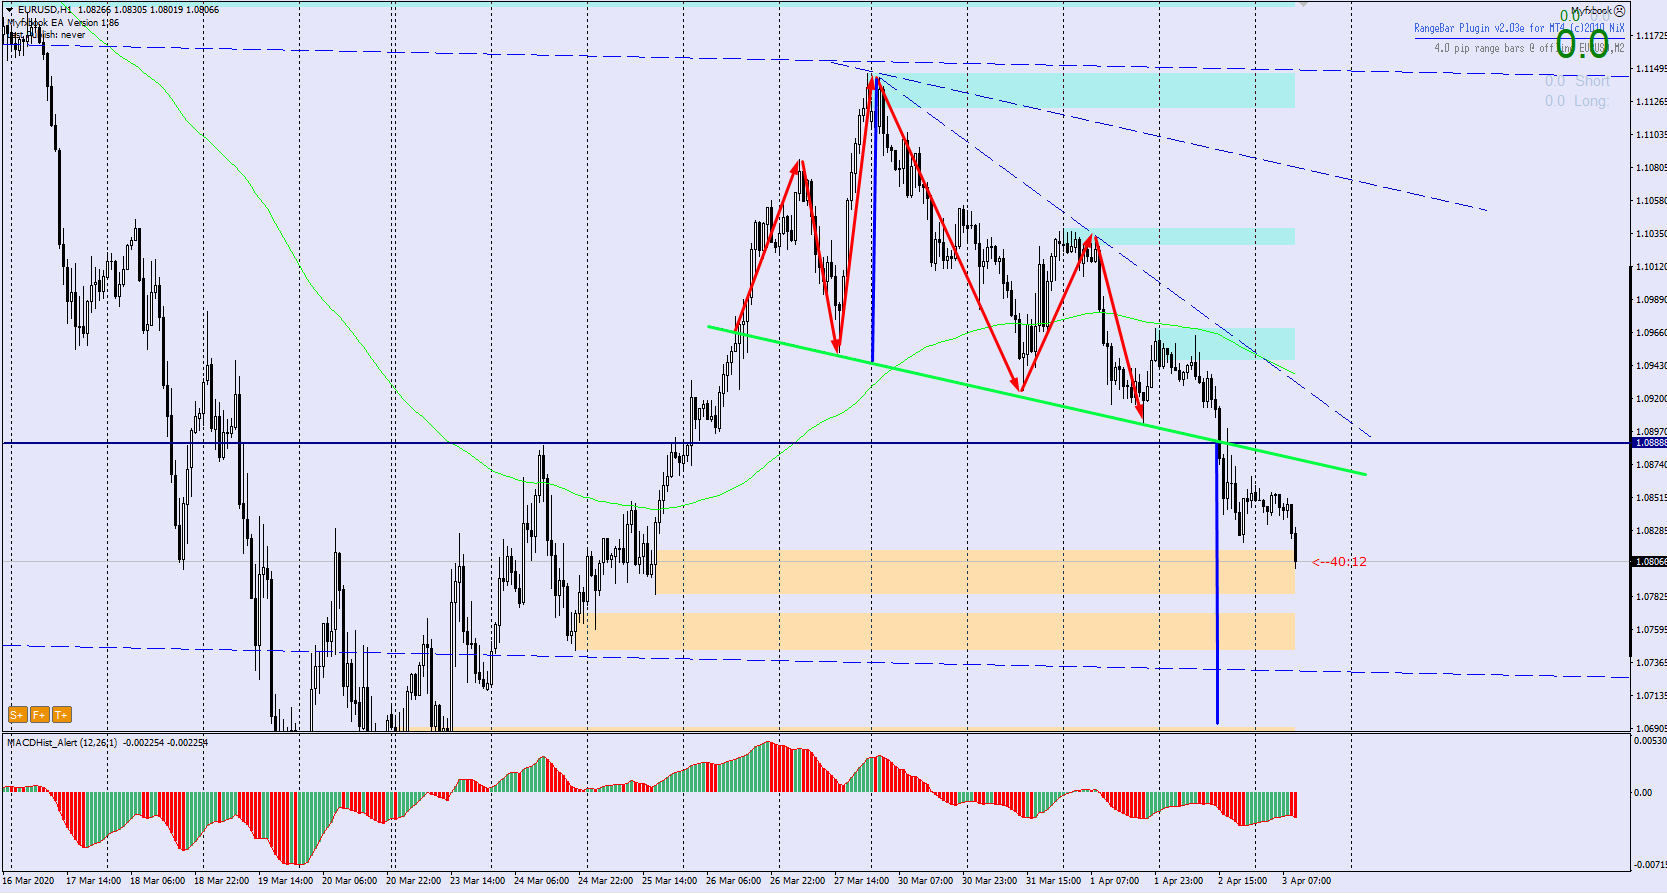
Recently few Head & Shoulders formations appeared on currency pair charts. On EURUSD one has already ended (described here), after crossing the neck line the dips reached 400p, according to the theory that the expected dips can reach the height of the formation measured from the top (head) to the neck line. Currently, the second smaller one is in progress… as you can see in the attached picture.
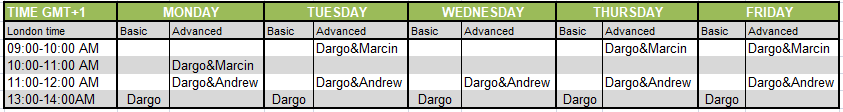
From Monday to Friday – Live trading at 13:00 (London time) chat, analyse and trade with me: https://www.xm.com/live-player/basic
Meanwhile, the USDJPY is preparing another opportunity to take a good position. This is best seen in the H4 chart.
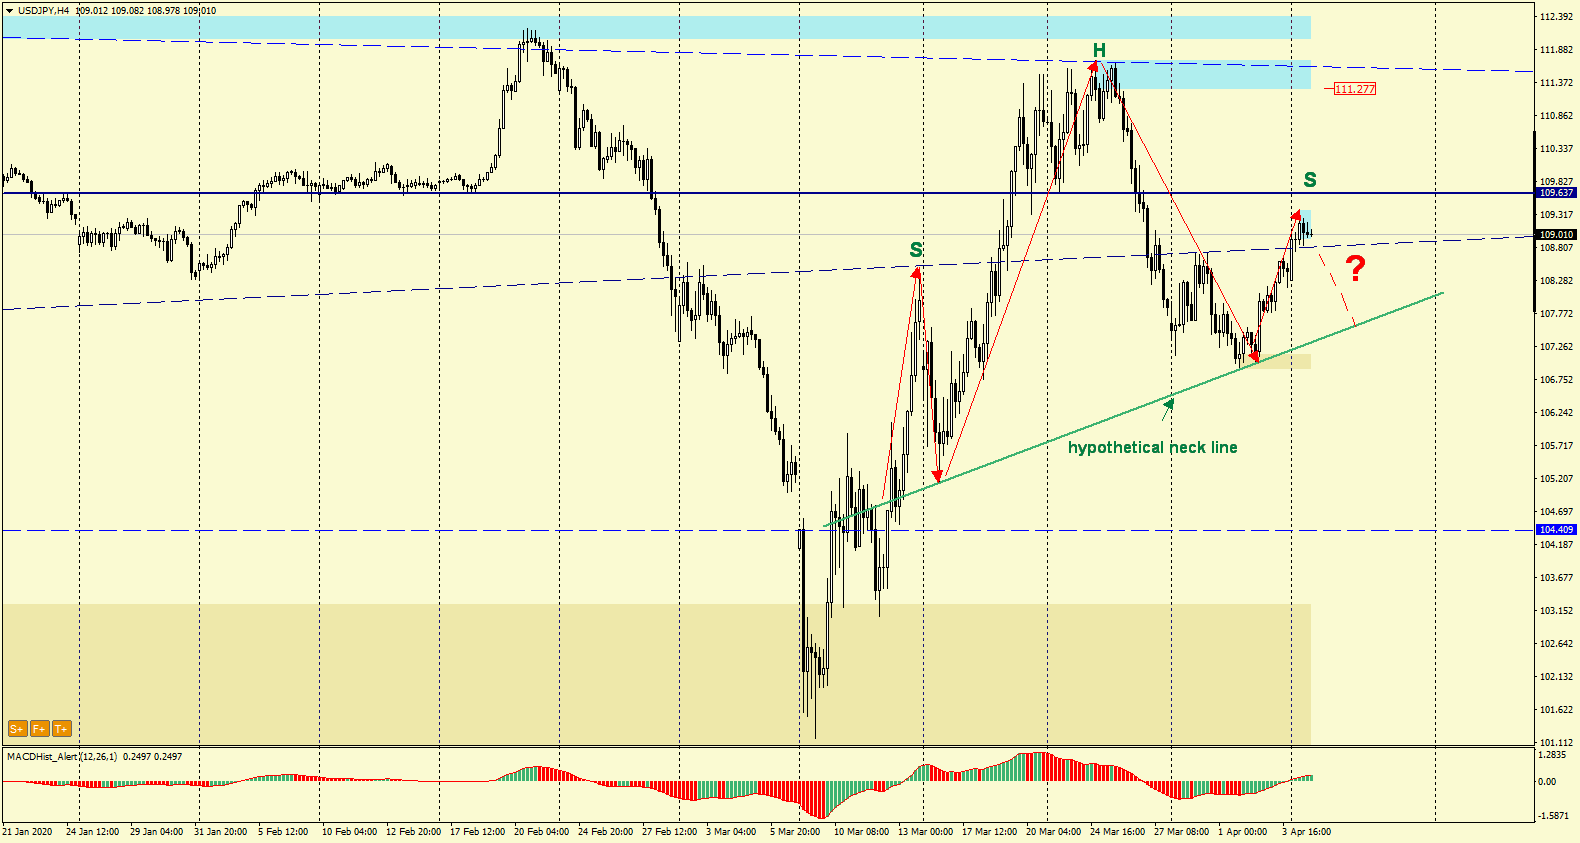
Here the left arm and head are already formed, we are currently observing the pair growing after rebounding from the hypothetical neck line. The fate of the formation can be determined by a strong S/R 109.60, which can stop the growths and direct the quotations southwards. However, if the level is overcome, the probability of falls and the formation of an H&S will decrease significantly.
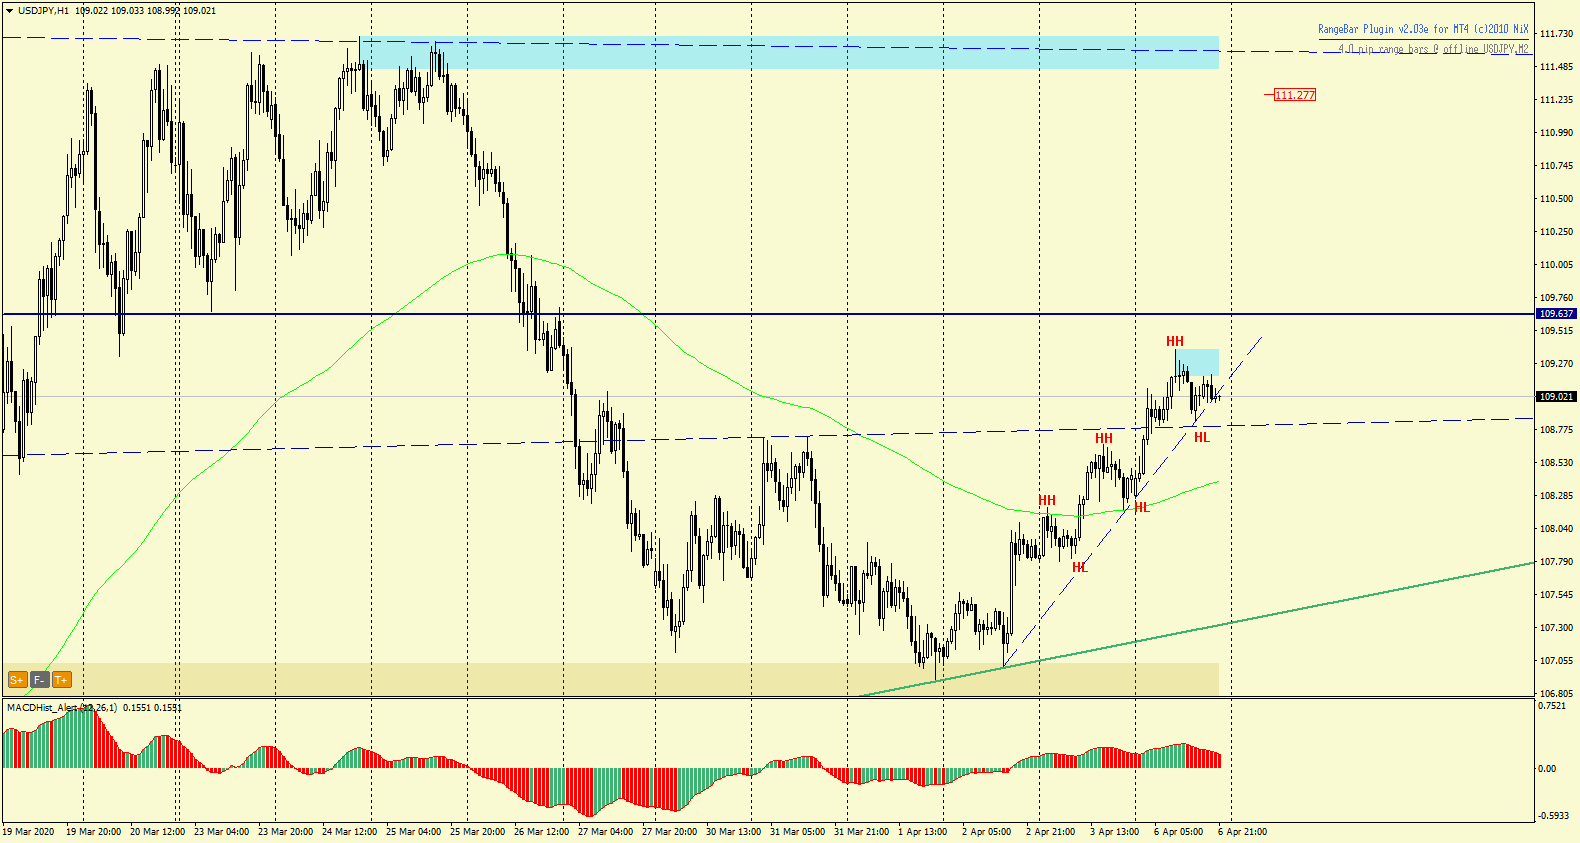
It seems that whether the RGR will become complete and the right arm will be completed will be determined by breaking the trend line (chart H1) according to which the price moves so far. This will negate a sequence of higher highs and lows which may result in a local downward trend.
In our Facebook group, which you can join anytime: https://www.facebook.com/groups/328412937935363/ you will find 5 simple strategies on which my trading is based. There, every day we post fresh analyses of currency pairs and commodities


 Review")


