GBPUSD – the cable after a series of violent falls in the first half of March this year and setting the all-time low at 1.1400 , it equally rapidly recovered lost pips and as a result made up 60% of the losses at the end of the month.

In June (11.06), the pair’s price reached 1.2760, and a pinbar appeared on the daily chart which triggered the falls. The price is already below the local trend line.
You can see me trading live every day from Monday to Friday between 1 p.m. and 2 p.m. (London time). During the live sessions I make analysis and show how I trade according to my strategies, I will also answer to your questions in the chat room. All you need to watch my live sessions is enter here: https://www.xm.com/live-player/intermediate
In the H4 chart we can recognize the H&S formation, the neck line (green) has already been defeated and re-tested from below. During the re-test, a candle with a long top wick appeared, indicating a bearish attitude towards the British pound and a rejection of the neck line level.
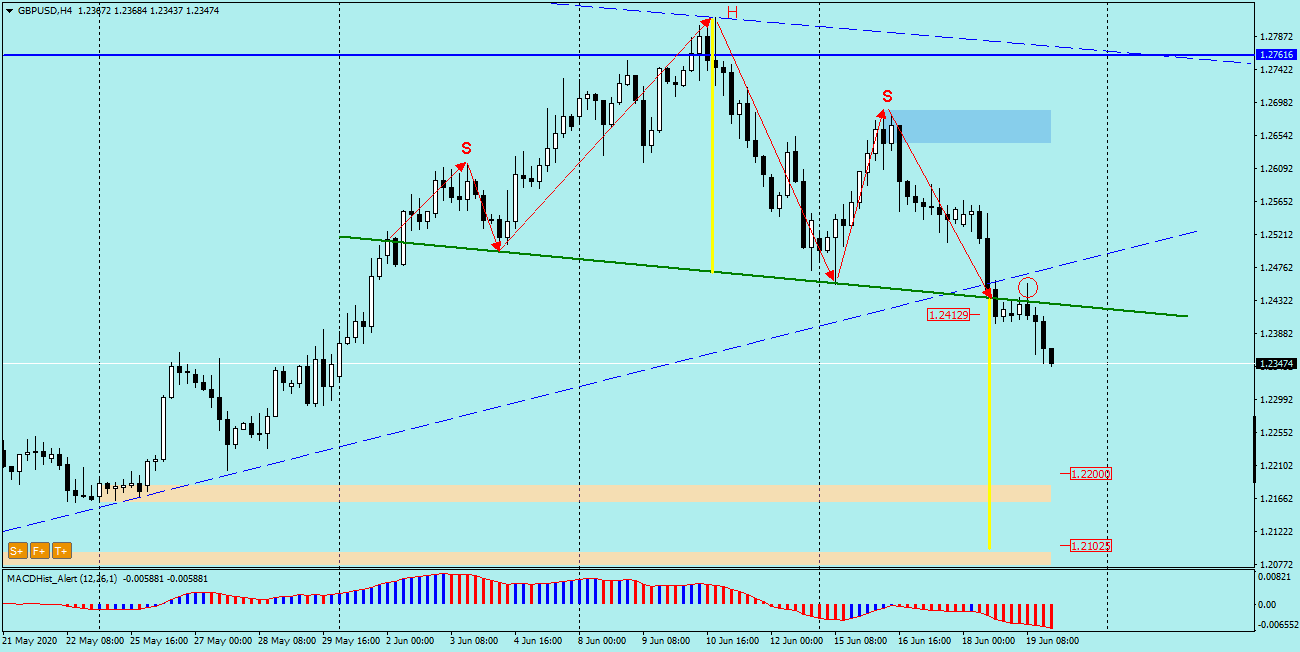
The size (height) of the Head and Shoulders is 340p and if the market behaves in accordance with the theory, then falls of similar range can be expected, i.e. the supply target can be 1.2100.
Two demand zones 1.2310 and 1.2230 are an obstacle to reaching the target, which can slow down the falls and trigger corrective movements
Corrections can be a good opportunity to join sellers.
In our Facebook group, which you can join anytime: https://www.facebook.com/groups/328412937935363/ you will find 5 simple strategies on which my trading is based. There, every day we post fresh analyses of currency pairs and commodities


 Review")


