Pound sterling to American dollar moves in a broad consolidation (since May), between 23,6% Fibo (2014-2015 downtrend) and highs near 1.5800. Between August and September, price actively tested the bottom of trading range, which ended with a dynamic rebound. Rate stopped however under 200DMA and 1.5480 S/R level – series of pin bars was crated there, and they caused declines. Yesterday’s session brought once again a try to test the zone.
In this spot it is worth to look again for sale signals, as well as to monitor the situation on an intraday chart. Breaking above current levels opens a road to 1.5550 (38,2% Fibo). Consolidation upper limit will be the next target (it was tested last time in August).

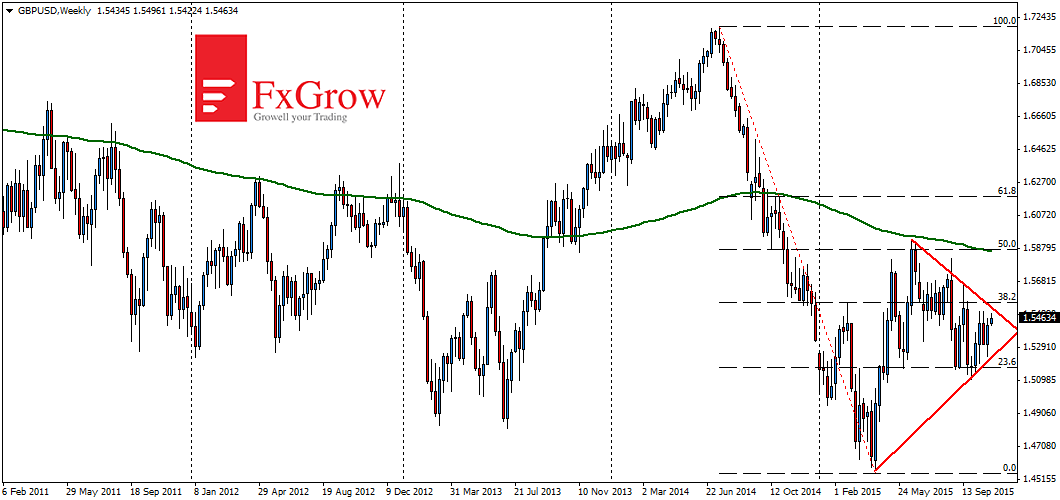
Broader view, W1 time-frame
Weekly chart shows that price moves inside sharply sloping triangle. Rate has less and less space inside and breaking below or above the pattern will be an important signal for the creation of a medium-term movements.


 Review")


