TRADE BTC OPTIONS THANKS TO TOPOPTION
For the technical analysis I will use primarily:
- Trend lines
- Resistance and support levels
- Classic TA basic formations (triangles, wedges, flags)
- Basic Price Action patterns (pin bar, inside bar, outside bar)
- Fibonacci retracement to determine potential support and resistance levels
BTC/USD D1
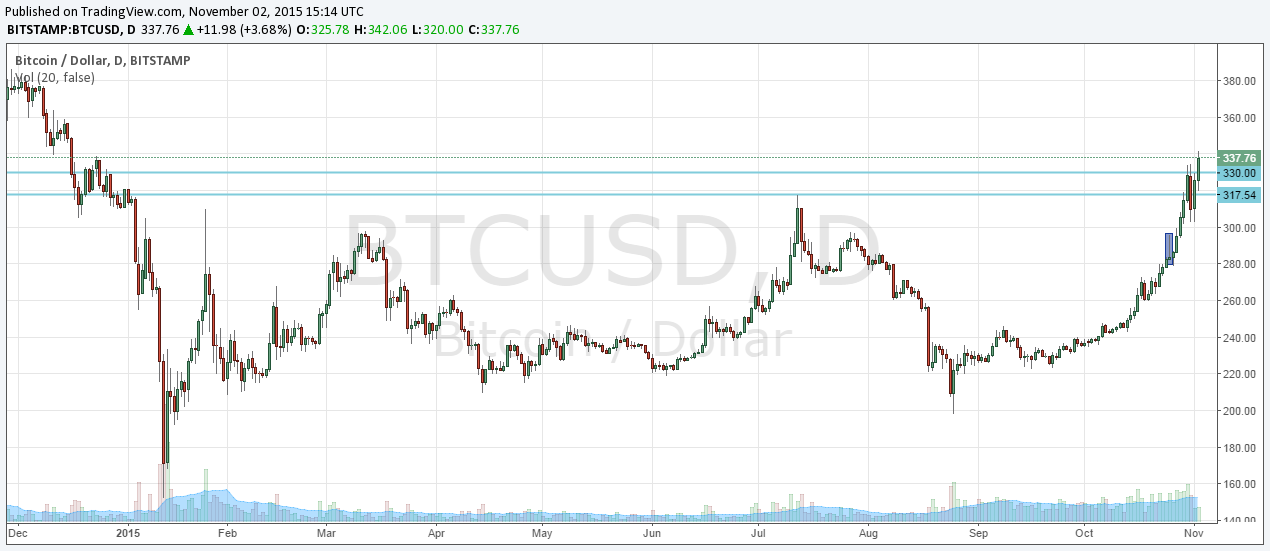
In last week’s daily chart analysis I was talking about pin bar candle just below local resistance. I suggested, that it might be a correction signal in recent dynamic increases. Bulls however, are in the gas and ignored bearish pattern, still moving up. Price was tumbling a while under YTD highs and 330.00, but eventually defeated them and during Monday’s session moved even above 340USD for a short period of time.
BTC/USD H4
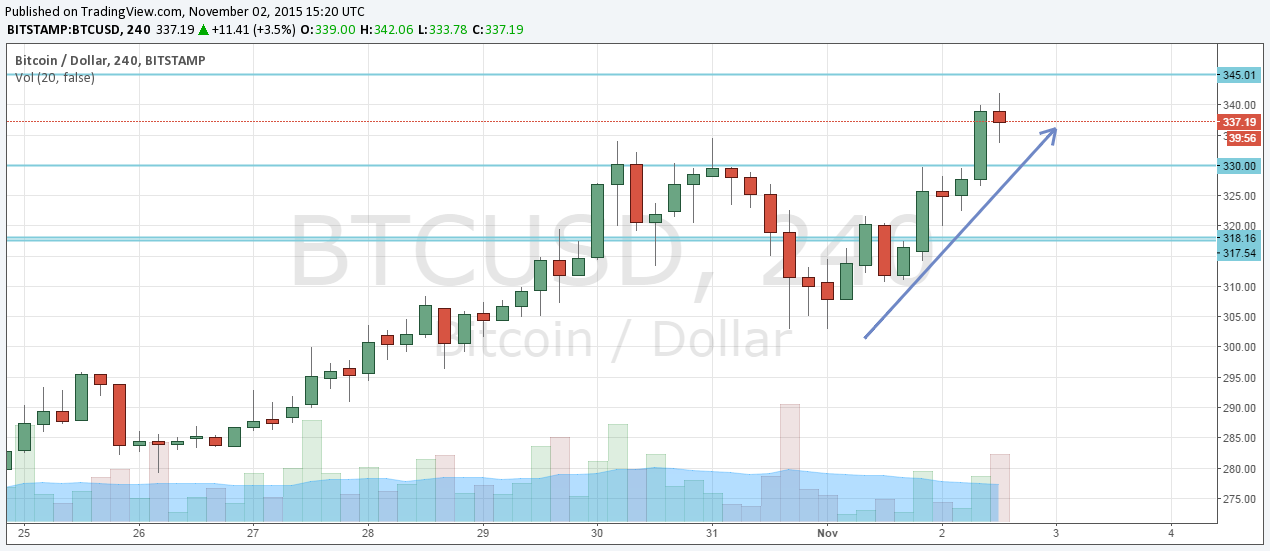
When I was writing about Bitcoin yearly highs (October 30th) I have also suggested a rebound from support 318.00 and further increases. Finally, a correction has moved decidedly lower (stopping just above 300.00). But the scheme has been implemented and new highs above 330.00 were reached. Now BTC/USD has another obstacles in front – 345.00 (weekly chart). We may consider two scenarios here – rebound, correction and further upward movements or breaking above, re-test from the top (correction) and also increases.


: Structure and Governance By Specialist Hay Nakash")


