Monday is a good day for analysing weekly charts. Let’s take a look at the GOLD chart, and what we can see is that last weekly candle has completely covered the previous one, creating a bearish engulfing formation.
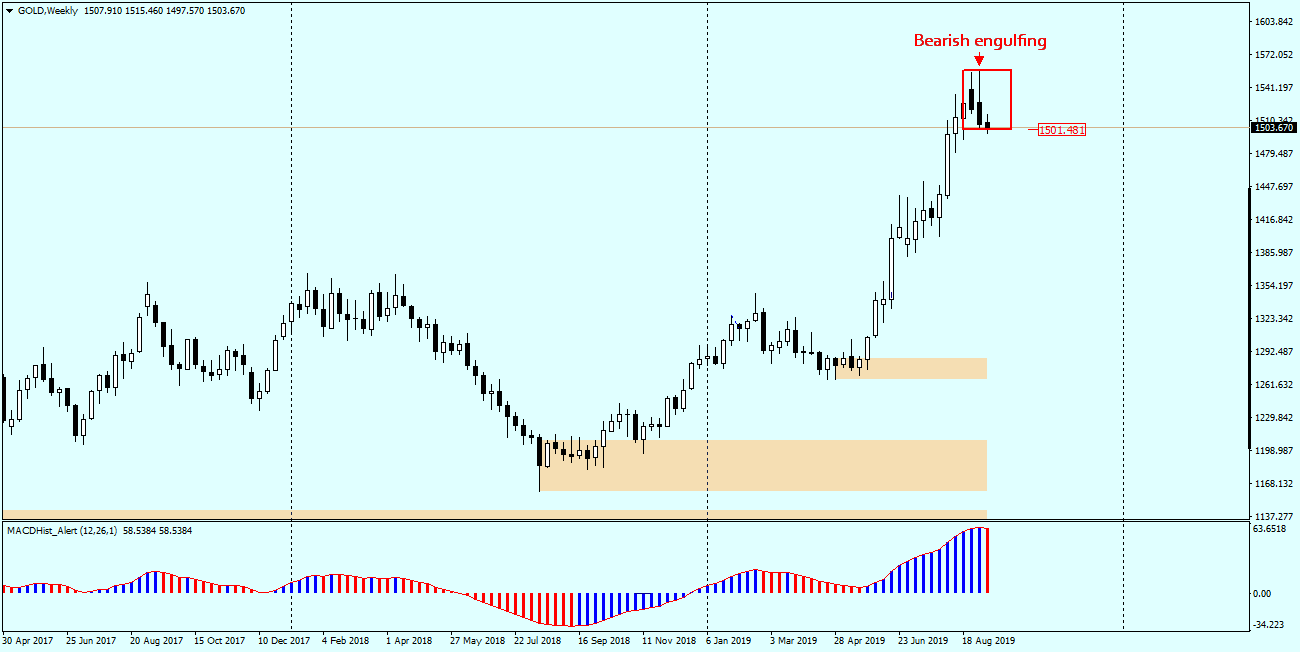
This is a pretty strong sell signal, on the condition that the breaking the bottom of the pattern is confirmed by the daily candle closing below the minimum of last week.
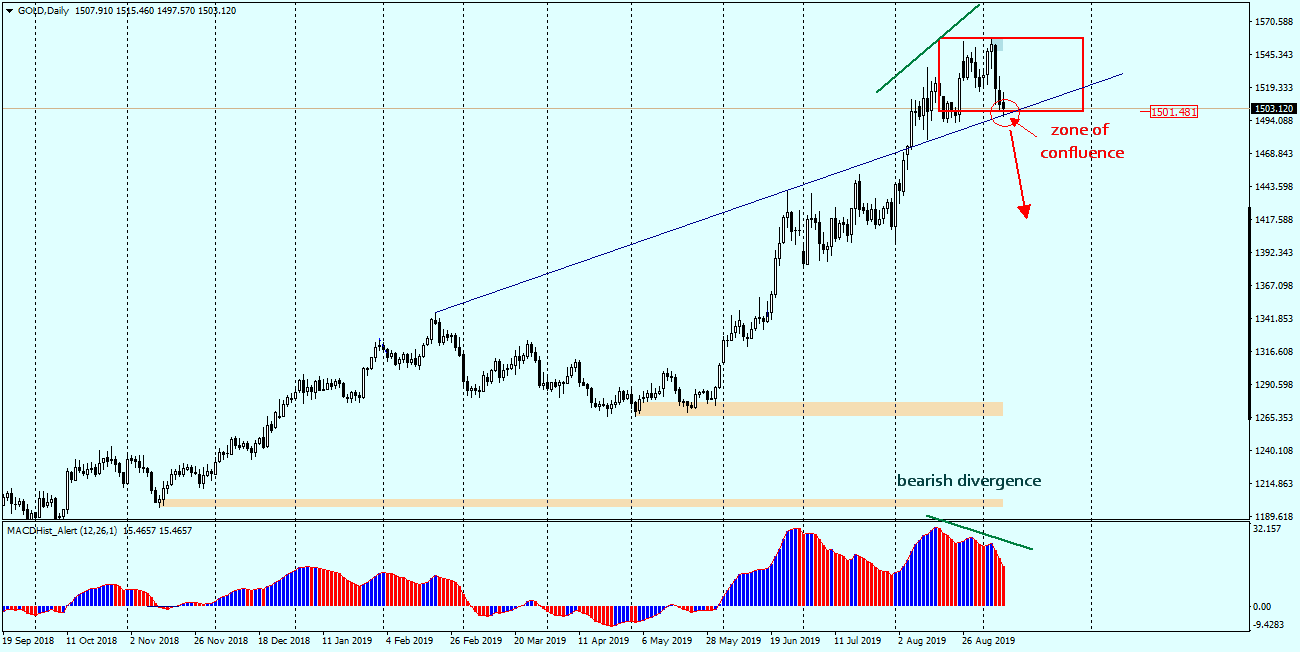
If you go to the daily chart, you will notice that the price is currently in the confluence zone resulting from the crossing of the trend line, which was defeated at the beginning of August this year, and the lower limit of bearish engulfing formation from the weekly chart. Additionally, we have a lasting bearish divergence, which together with the decreasing MACD on the weekly chart would indicate further decreases in the price of gold. The condition for taking a short position in this case will be to overcome the confluence zone, i.e. the area between 1500-1497 $/oz.
 In our Facebook group, which you can join anytime: https://www.facebook.com/groups/328412937935363/ you will find 5 simple strategies on which my trading is based. There, every day we post fresh analyses of currency pairs and commodities


 Review")


