The first week of September showed that the holiday moods were already behind us, the volatility returned and there were signs of vitality both on the stock exchanges and on the forex market.The topic of Brexit is still at the forefront of the media, whether in traditional newspapers or online.
The deadline of 31 October 2019 forced by Boris Johnson for leaving the EU, with or without an agreement, does not find sufficient support in parliament. New elections are in the pipeline and decisions on this matter are likely to be taken on Monday. This has an impact on the ratings of the British pound. After the House of Commons passed a bill blocking the exit from the EU without an agreement, the GBP regained its strength and bounced back quite a bit, 400p from this year’s bottom established on 1.1960.
Traditionally, of course, as on the first Friday of the month we had payrolls. The market was a bit surprised, as it turned out to be 30 thousand jobs lower than expected. The dollar has started to lose a bit in relation to the other pairs, only the pound hasn’t gained anything, which suggests that the market is waiting for Monday’s news from the UK parliament.
This week I was analyzing NZDUSD, which for nearly 6 weeks has been moving in a strong downward trend and according to the assumptions of my PA+MACD strategy there were signs of a beginning of a correction. Let’s take a look at the charts below to see how the market has verified my theoretical deliberations.
NZDUSD 02-06.09.2019
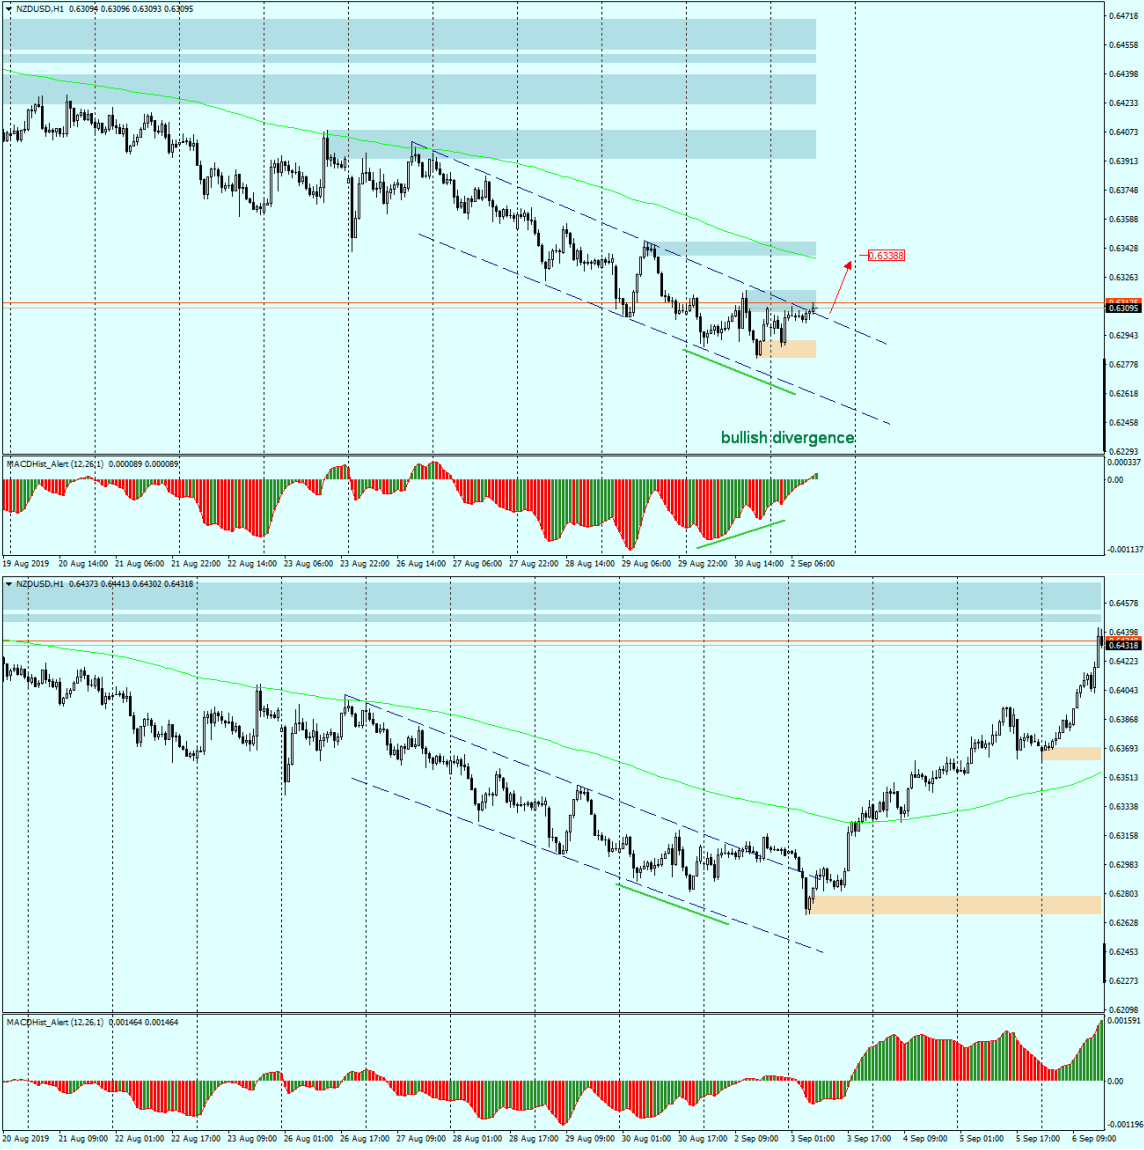
In the analysis from Monday: “NZDUSD – possible correction after 6 weeks of declines” – I wrote this way: “In the chart above (…) we have bullish divergence, which started on Friday afternoon during the American session, and today’s Asian session confirmed its continuation. And here, too, we have upward divergence in price/MACD. If the upward movement continues, the nearest supply zone of 0.6340 may be the first target of the current correction.
The nearest supply zone did not resist for long and the price rose much higher – 160p – from the moment of crossing the upper edge of the channel. It can be concluded that the strategy worked and the analysis worked.
It is worth looking at chart H1 and looking at it from the perspective of my second strategy based on EMA144.
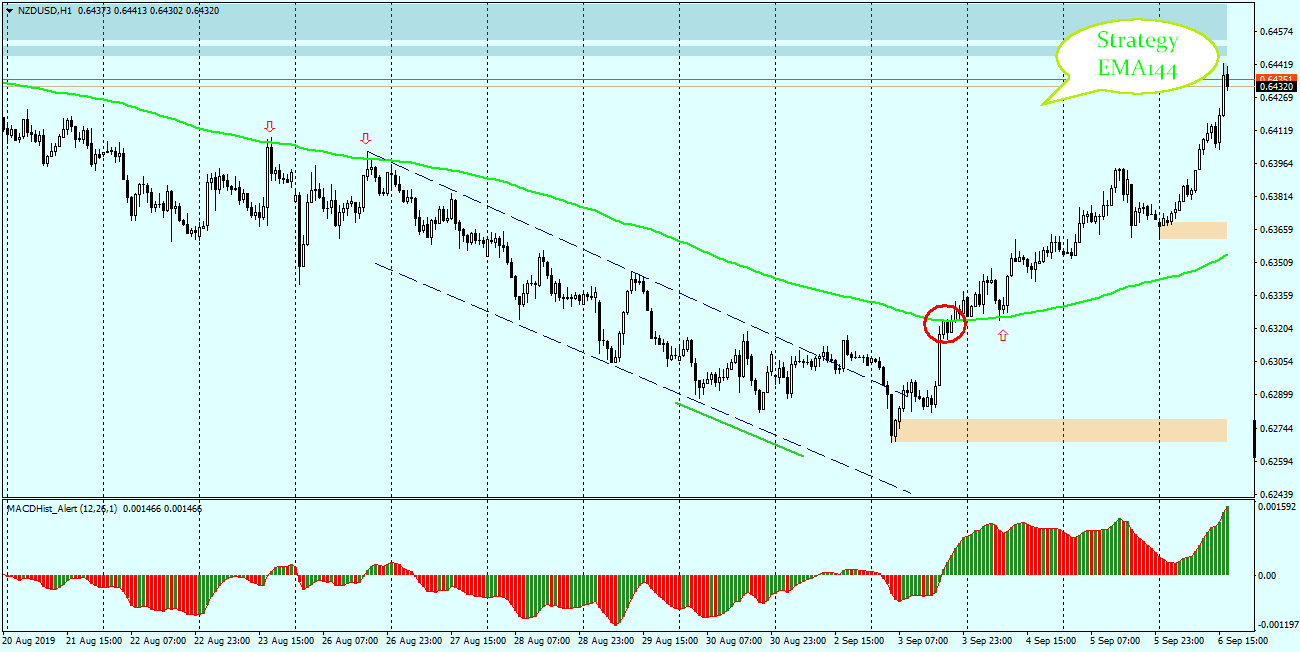
According to the assumptions of this strategy (description is here) – if the price respects the average as a resistance then after its decisive defeat (strong impulse) there is a high probability that it will work as a support during the first contact with the price and we can enter the market in its vicinity.
The attached chart shows that in this case it happened and the price after the re-testing of the average continued growth in the direction in which the average was defeated.
 In our Facebook group, which you can join anytime: https://www.facebook.com/groups/328412937935363/ you will find 5 simple strategies on which my trading is based. There, every day we post fresh analyses of currency pairs and commodities


 Review")


