GOLD – last week ended with a strong accent, the price broke the local trend line and ended Friday’s quotation at 1681 $/oz.
The “prophecy” from the previous analysis of this precious metal has come true, the sequence of higher highs (HH) and higher lows (HL) has been broken and we can conclude that the gold price has started a downward correction.
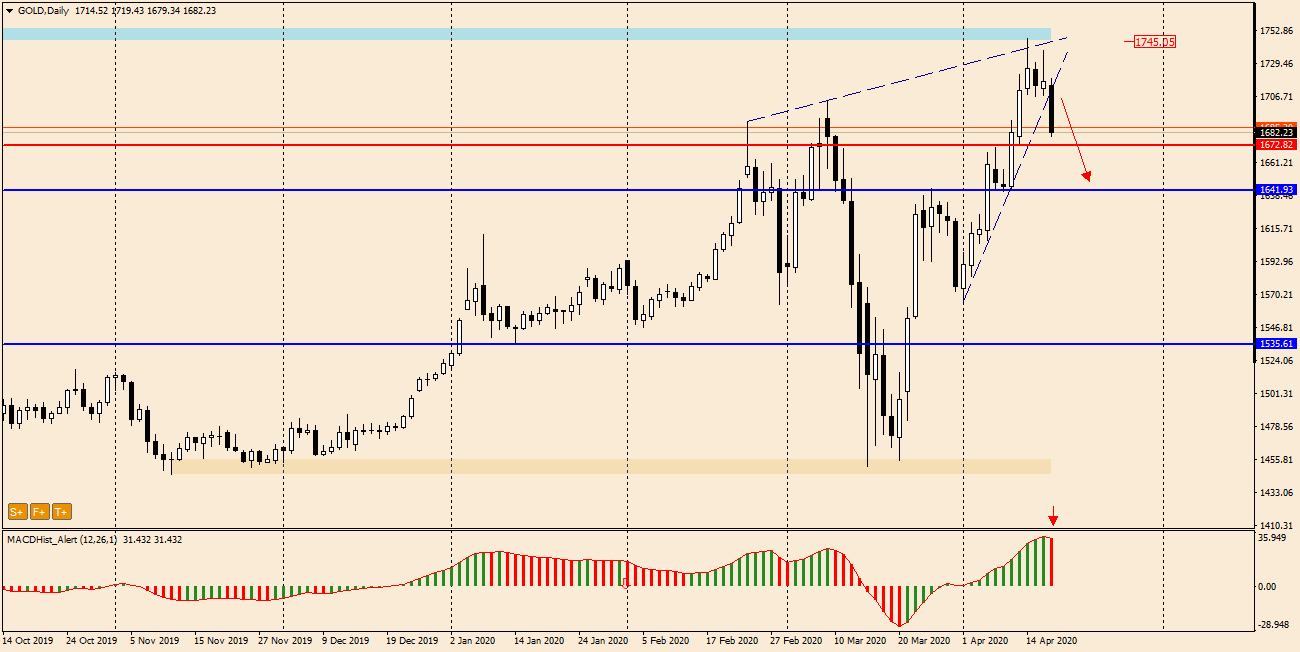
This scenario is supported by the appearance of a maximum on the MACD oscillator which is usually a signal to change direction on the price chart. The reason for the lower price of gold, which is a safe haven, may be the optimism in the financial markets caused by promising test results of a new drug, remdesivir, which is a cure for coronavirus disease.
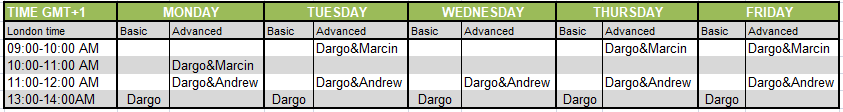
You can see me trading live every day from Monday to Friday between 1 p.m. and 2 p.m. (London time). During the live sessions I make analysis and show how I trade according to my strategies, I will also answer to your questions in the chat room. All you need to watch my live sesions is enter here: https://www.xm.com/live-player/intermediate
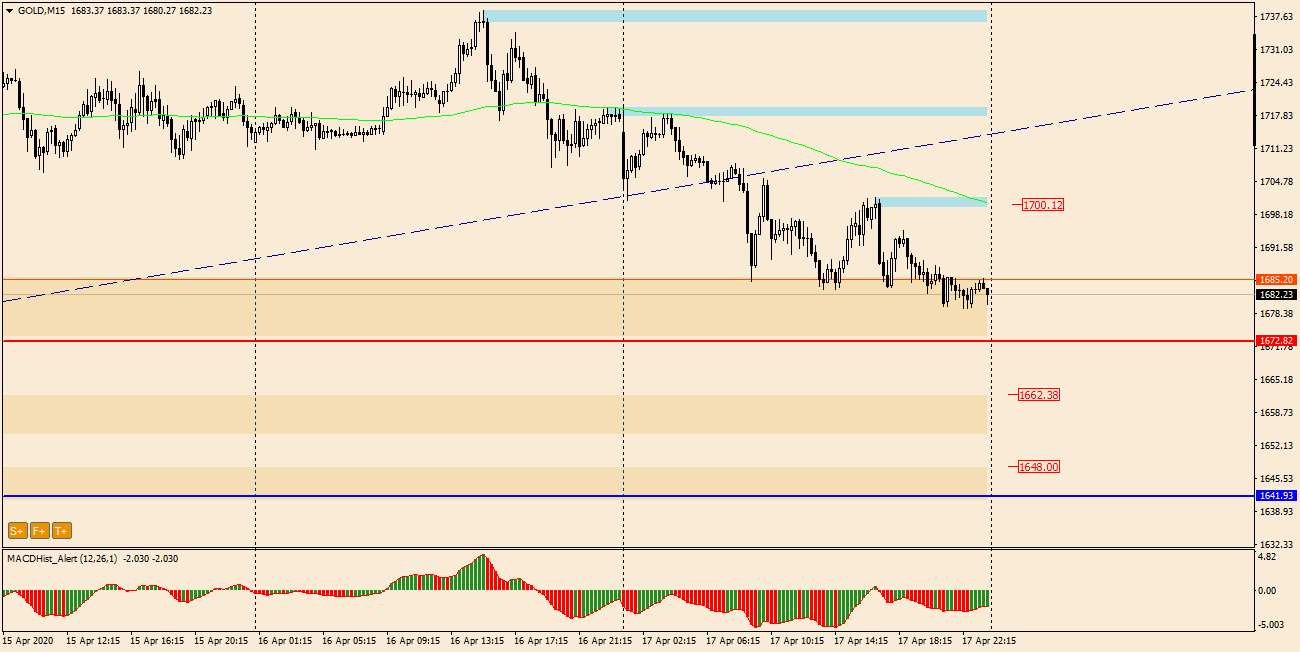
Moving on to the M15 chart, we can distinguish several consecutive levels which may be the target of supply. These are successively : 1662, 1648 and 1641. When planning a sell order, you need to consider the market trying to re-test the defeated trend line, which is about $30 above.
In our Facebook group, which you can join anytime: https://www.facebook.com/groups/328412937935363/ you will find 5 simple strategies on which my trading is based. There, every day we post fresh analyses of currency pairs and commodities


 Review")


