Last week the AUDUSD pair reached the level of 0.6450, which is exactly 61.8% of the last downward movement measured from a top 0.7030 to a minimum of 0.5500 this year (shown in the H4 chart). Currently the price has reached another important 50% fibo level. On chart D1 – MACD in the downward phase since yesterday.
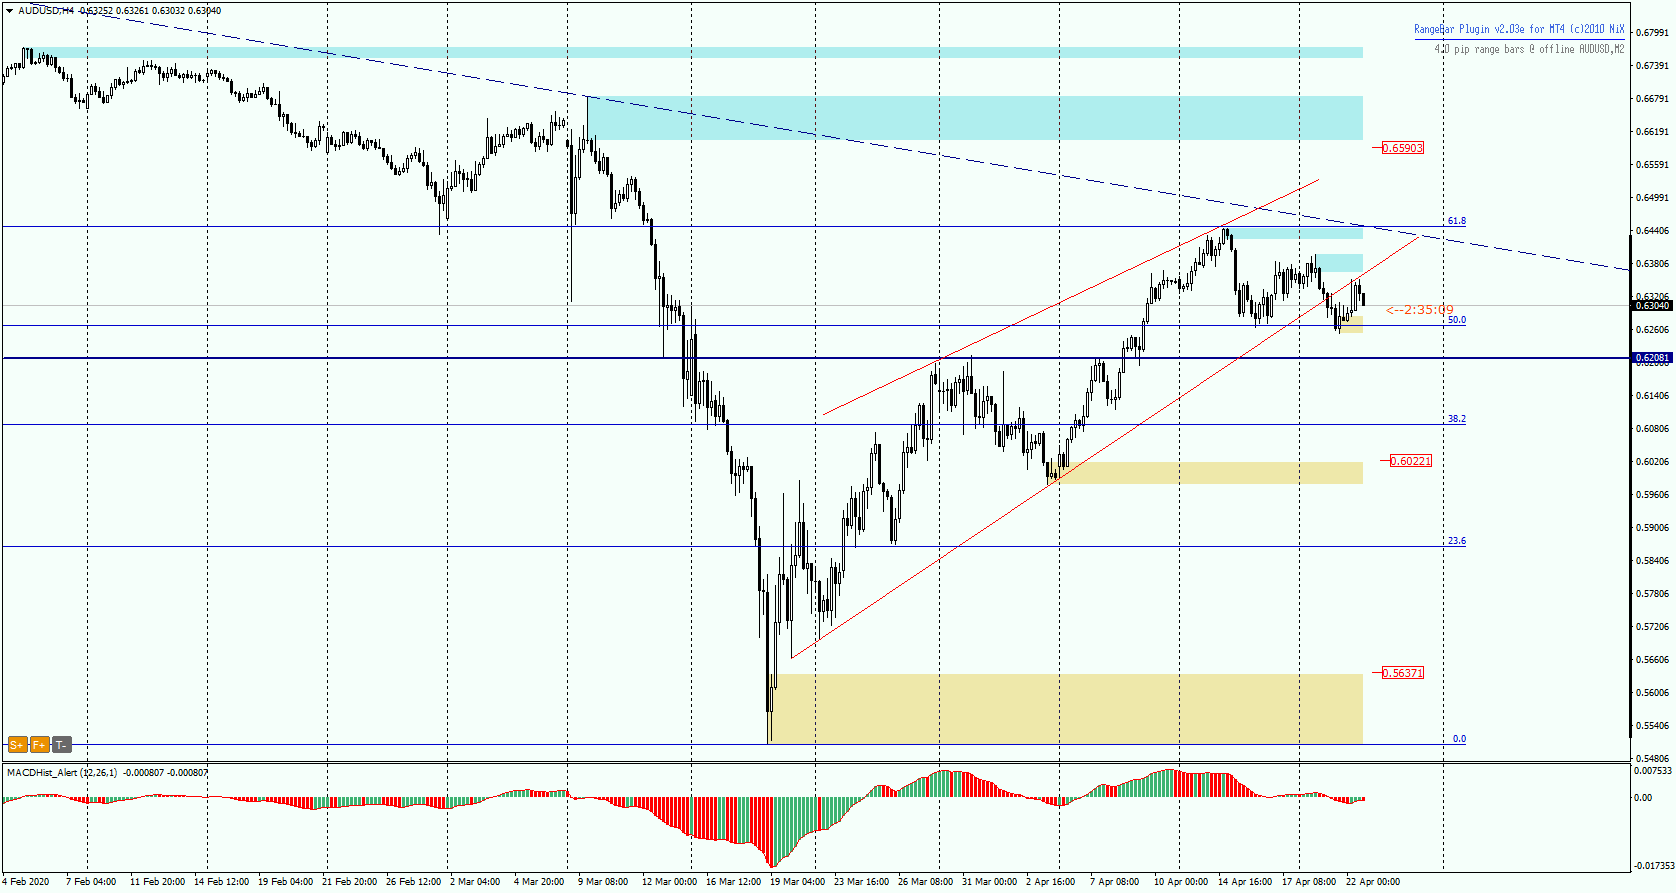
We also see that for more than a month the price has been moving within a rising wedge from which it broke down yesterday during the Asian session. Today we witnessed a re-test of the wedge’s support and the price went south.
From Monday to Friday – Live trading at 13:00 (London time) chat, analyse and trade with me: https://www.xm.com/live-player/basic
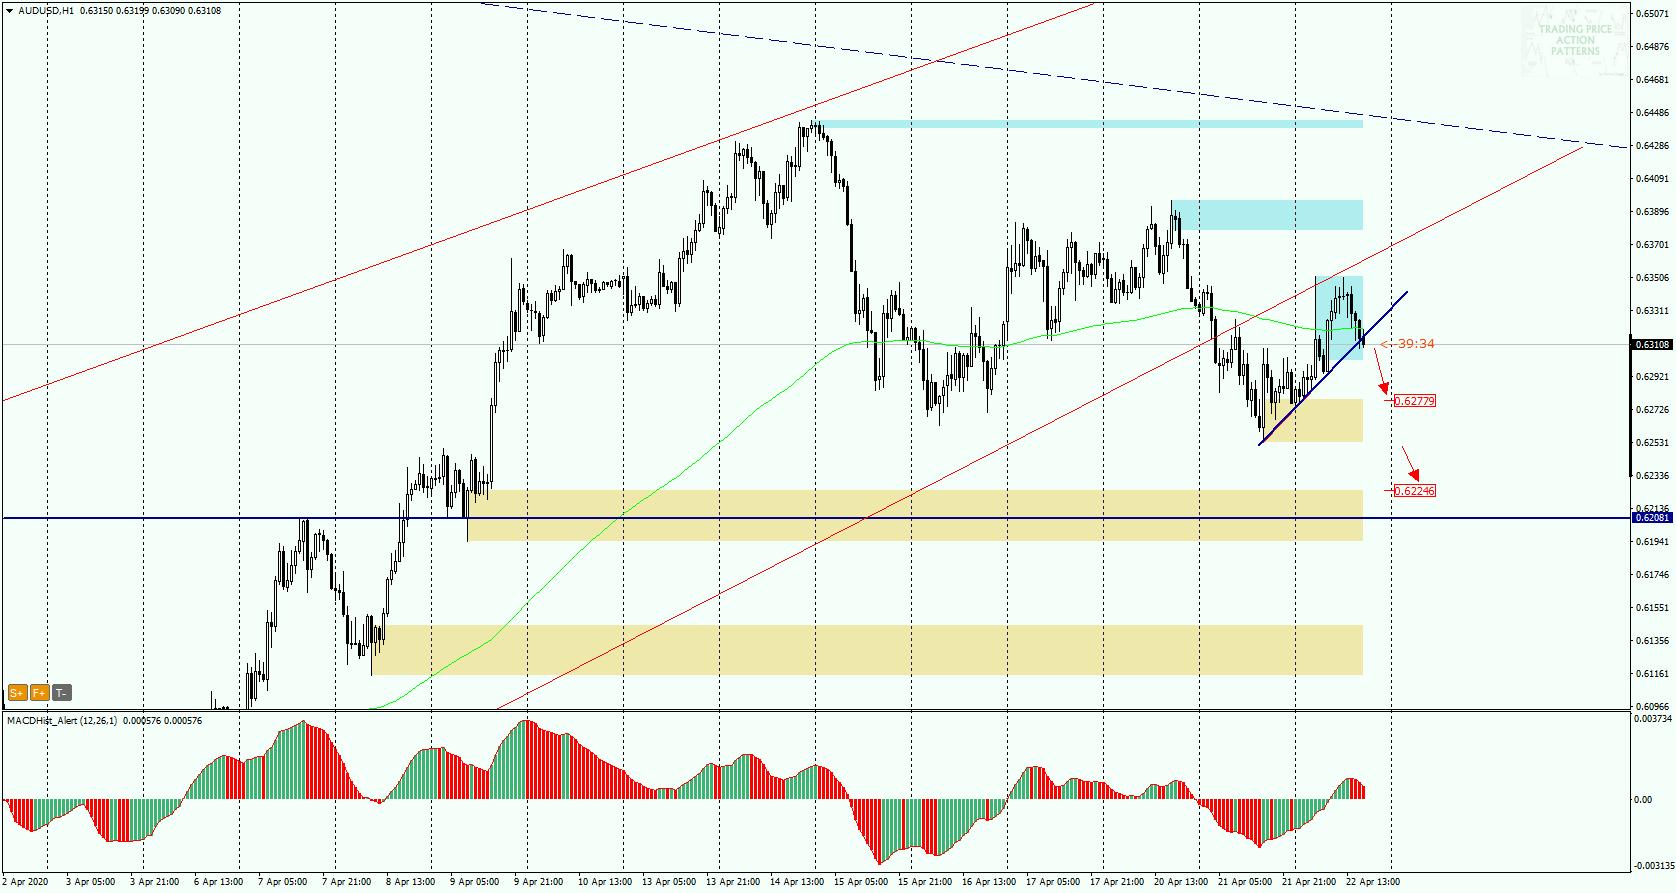
On the H1 chart we can draw a local upward trend line (blue), which seems to have already been beaten, so I expect that the declines will continue. The nearest demand zone is around 0.6278, it may be the first supply target. It is quite likely that further declines towards the next demand zone starting at 0.6225.
In our Facebook group, which you can join anytime: https://www.facebook.com/groups/328412937935363/ you will find 5 simple strategies on which my trading is based. There, every day we post fresh analyses of currency pairs and commodities


 Review")


