Gold is moving in a downtrend after reaching an all-time high of $2075/oz last July.
- gold in the demand zone
- is this the beginning of an upward correction
- confluence of resistance at 1760 USD/oz
Gold is moving in a descending channel pattern, which can also be called a bullish flag. At the beginning of the year there was an upward breakout from the formation, but three days later the price turned back and again found itself under the resistance of the flag (green line).
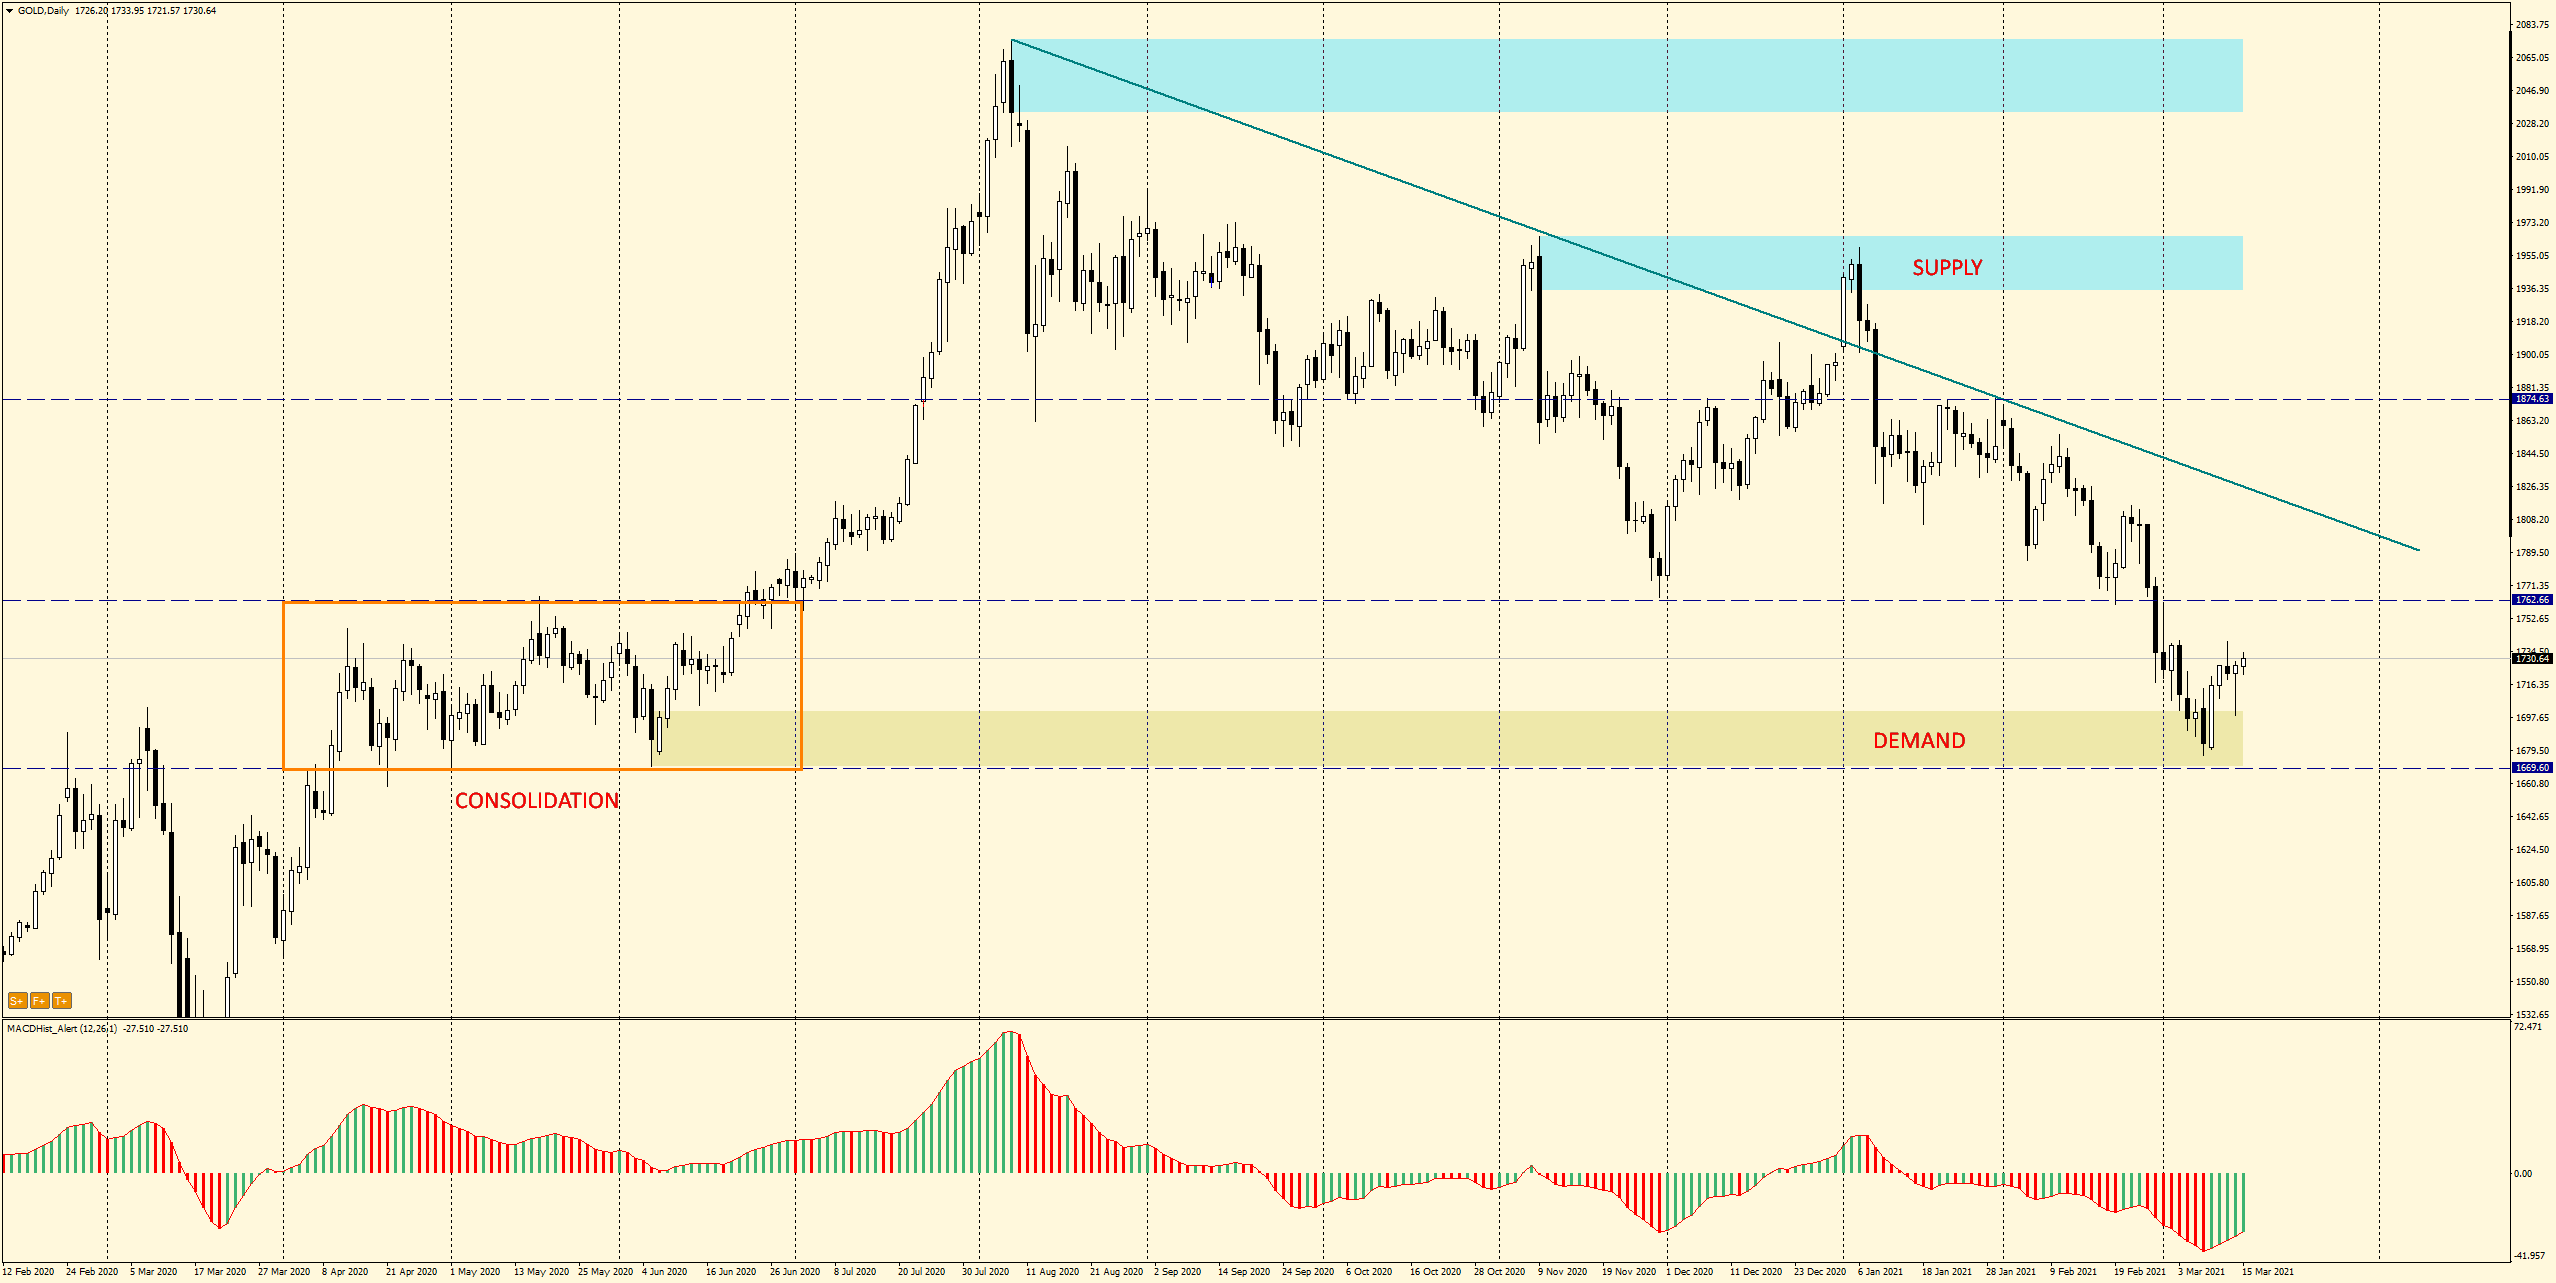
Last week, the price reached a strong demand zone.
We are currently observing the beginning of an upward correction, Friday’s daily candle has the shape of an upward pin bar, the minimum of which is located on the mentioned supply zone. This may signal the rejection, at least temporarily, of prices at this level. MACD is in an upward phase.
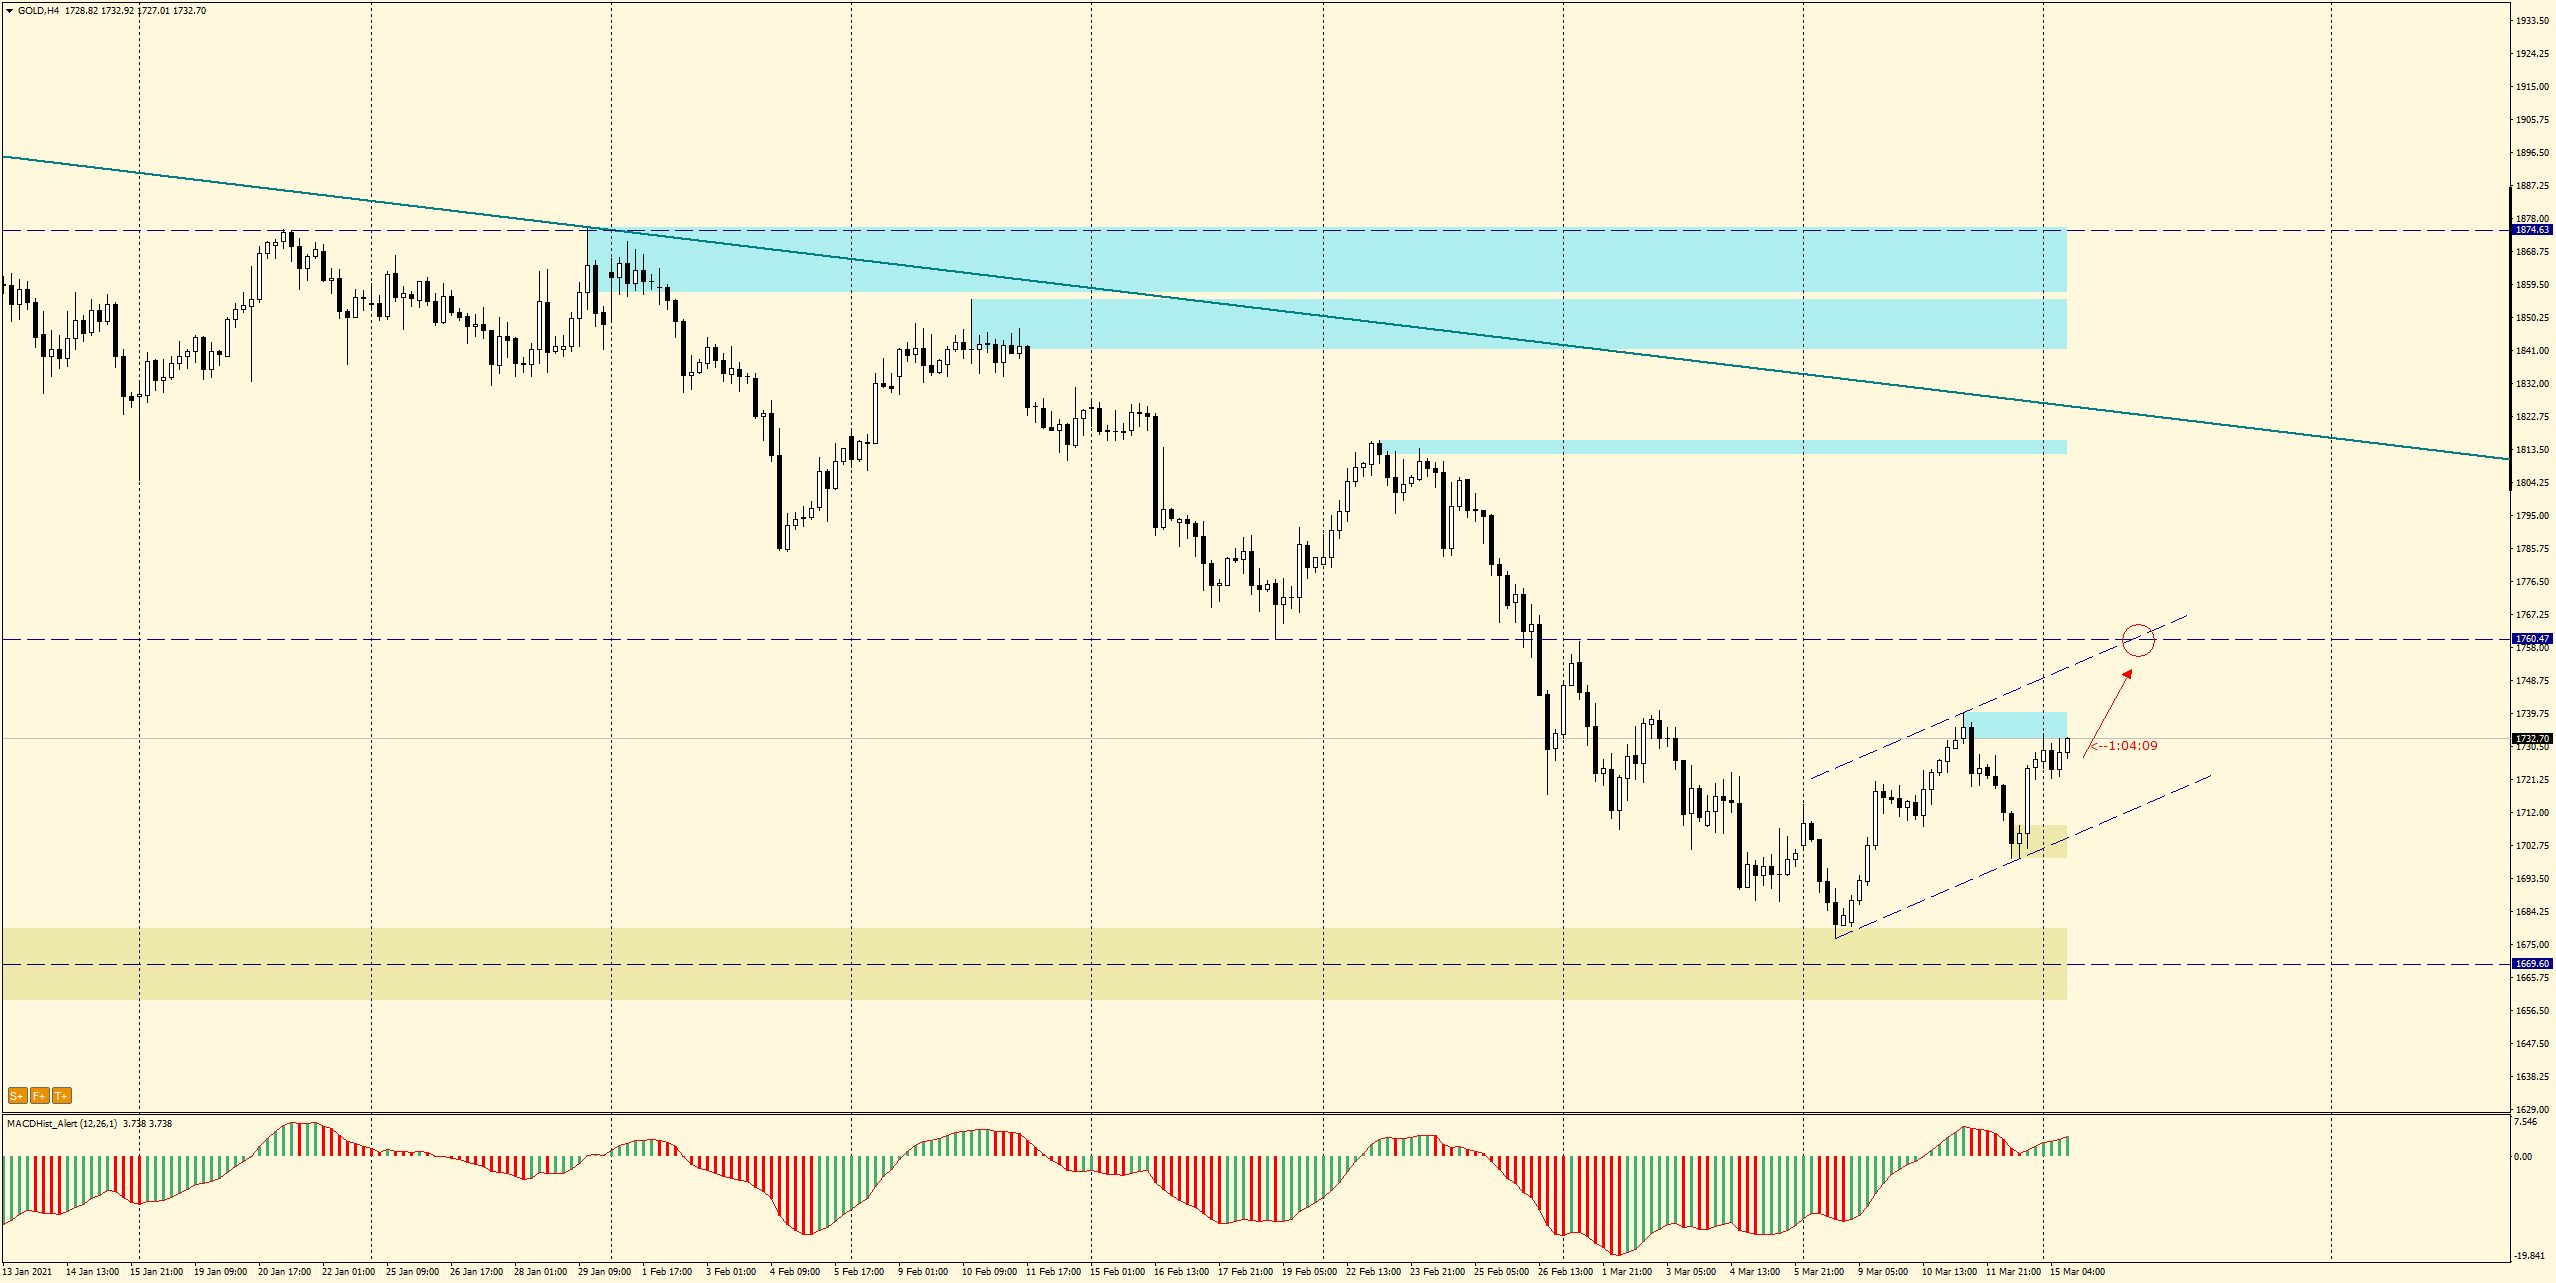
On the H4 chart, we will notice an upward channel forming. If the uptrend continues, the demand target may be the confluence of levels of resistance.
It is located at 1760 $/oz. There the S/R level and resistance of the emerging channel intersect.
It is also worth noting the consolidation from 2020 (daily chart) – the aforementioned S/R level also marks the upper range of this consolidation.
I recommend the description of the strategy used for this analysis:
ongoing analysis https://t.me/TradewithDargo
 In our Facebook group, which you can join anytime: https://www.facebook.com/groups/328412937935363/ you will find 5 simple strategies on which my trading is based. There, every day we post fresh analyses of currency pairs and commodities. You can also visit my channel where I post my trading ideas: https://t.me/TradewithDargo


 Review")


