Gold quotations peaked this year on 8 March. Two weeks after Russia’s attack on Ukraine, the gold price started to fall quite intensively. Last year, the price of $1680/oz failed to surrender on a number of occasions to supply and proved to be a two-year strong support. Also this year, a bullish engulfing appeared at this level in mid-July and the price rebounded by more than $120/oz. However, the final weeks of September proved less kind to gold and the price fell back to 2020 levels, setting a minimum for the year at $1615/oz.
Bullish engulfing patterns in gold
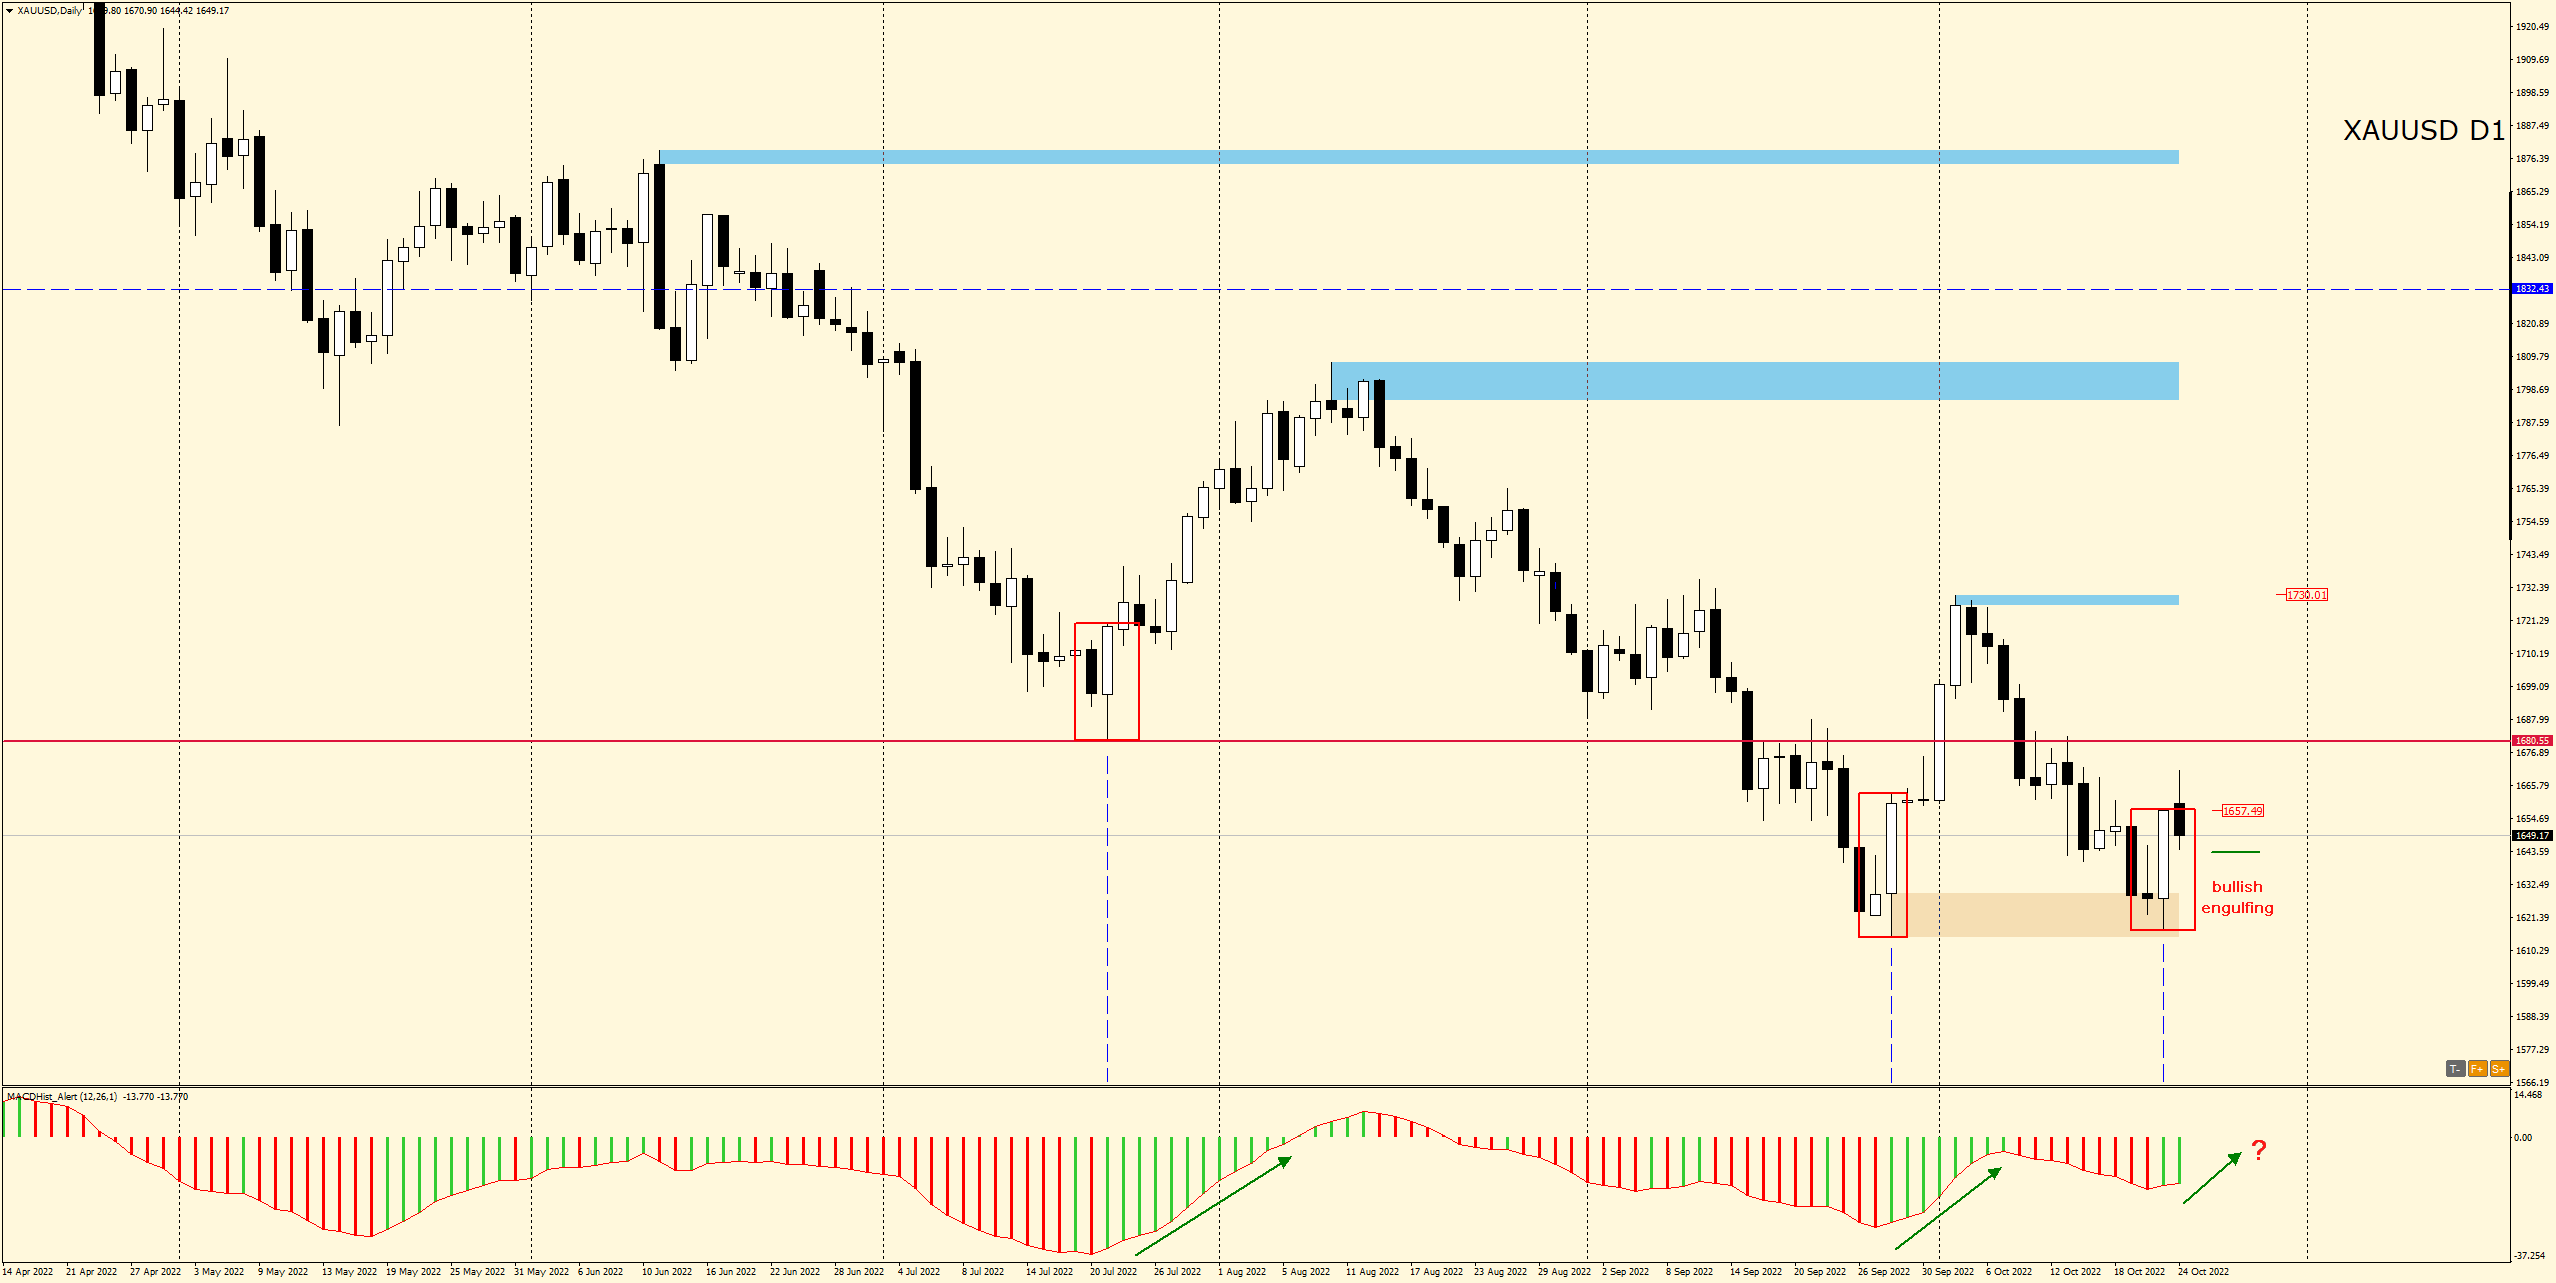
In October, the price of gold fell steadily and last Friday it was again at the minimums of this year. However, by the end of the day, price went north and the week closed at $1658/oz.
Friday’s candle formed a bullish engulfing formation, just as it did at the end of September. The September formation appeared to be the start of an upward correction.
Looking deeper into gold’s trading history, we see that a bullish engulfing formation also appeared in July this year, which also initiated an upward correction.
Each time a bullish engulfing is formed, the MACD oscillator enters an upward phase (green) confirming a change in sentiment on gold.
If history were to repeat itself, conditions for an upward correction have also currently emerged.
Double bottom – is this a signal to buy?
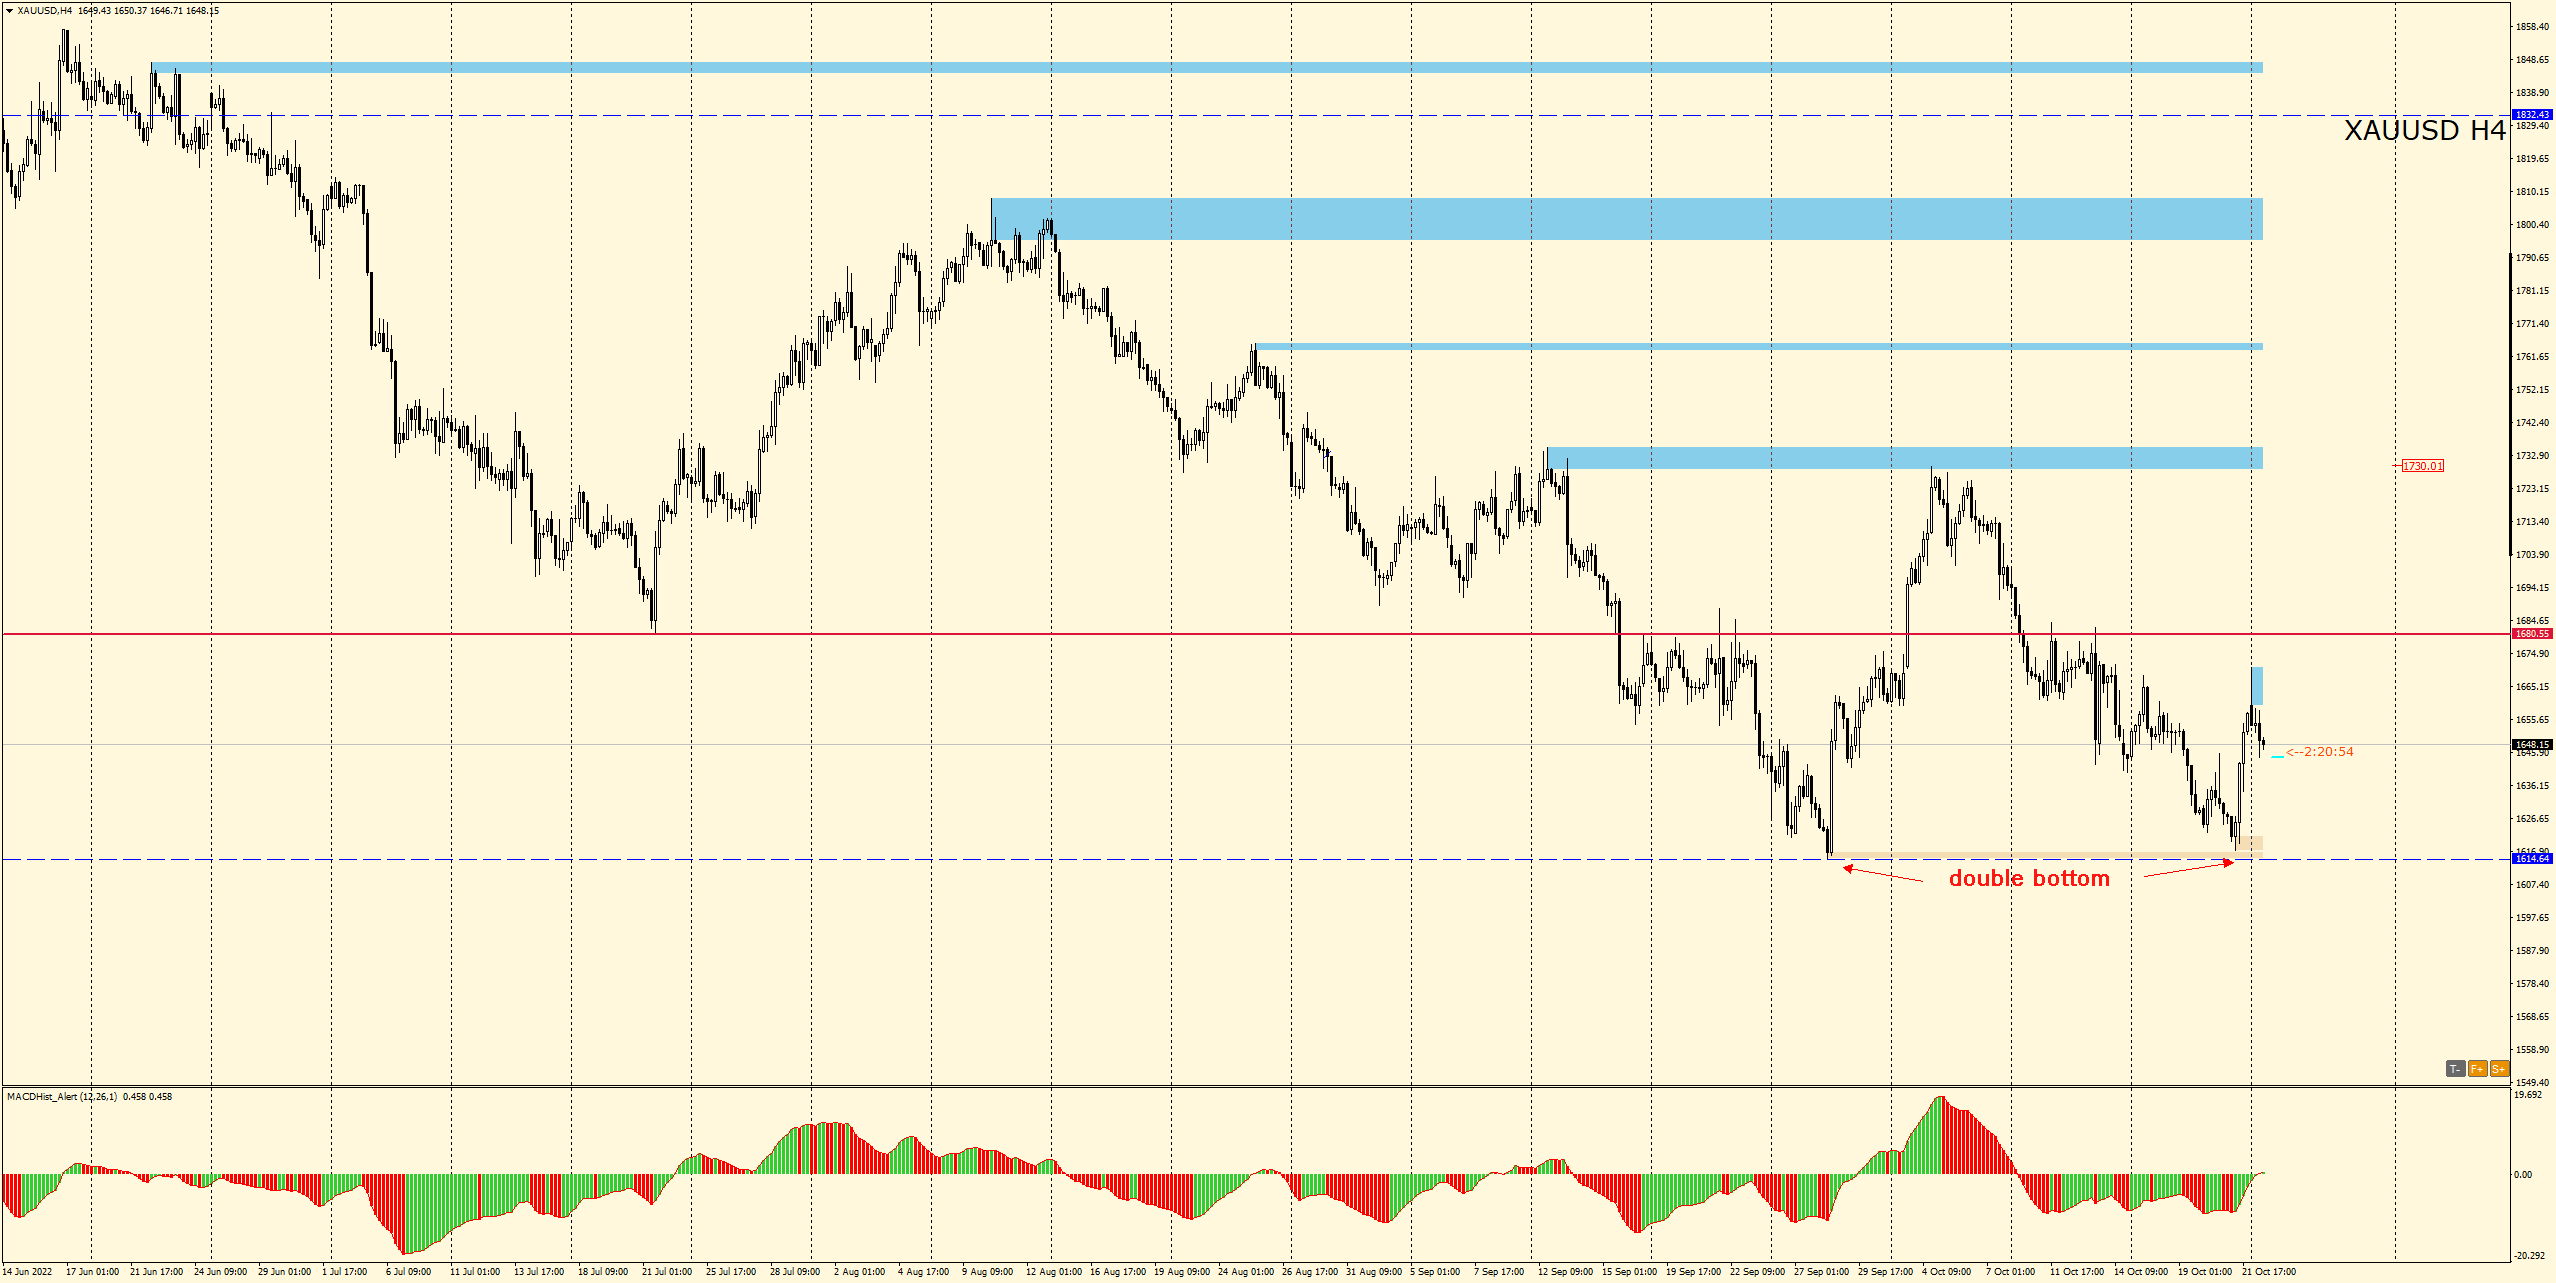
A double bottom formation has appeared on the H4 chart. However, in order for it to be considered complete, the price of gold would have to reach the potential neckline located at 1730. On the way, the price may encounter the support/resistance level at 1680. Overcoming it will open the way to further increases.
I will have the opportunity to talk about Gold and several other instruments during my daily live analysis,
LIVE EDUCATION SESSIONS
This October I am pleased to invite you to several online sessions. Below is the schedule of meetings:
 Links: BASIC (beginners room) ADVANCED ROOM
The above analysis is based on the PA+MACD strategy, a detailed description of which you can read HERE . I will talk more about the PA+MACD strategy applied to these currency pairs during the live trading sessions which you can attend from Monday to Friday.
More current analysis on the group : Trade with Dargo
 In our Facebook group, which you can join anytime: https://www.facebook.com/groups/328412937935363/ you will find 5 simple strategies on which my trading is based. There, every day we post fresh analyses of currency pairs and commodities. You can also visit my channel where I post my trading ideas: https://t.me/TradewithDargo


 Review")


