GOLD, gold… this precious metal is increasingly being considered as an investment to protect our savings against inflation. The money printing used by most central banks to save the economies of countries affected by the coronovirus pandemic does not go hand in hand with increased production.
It must sooner or later lead to an increase in inflation.
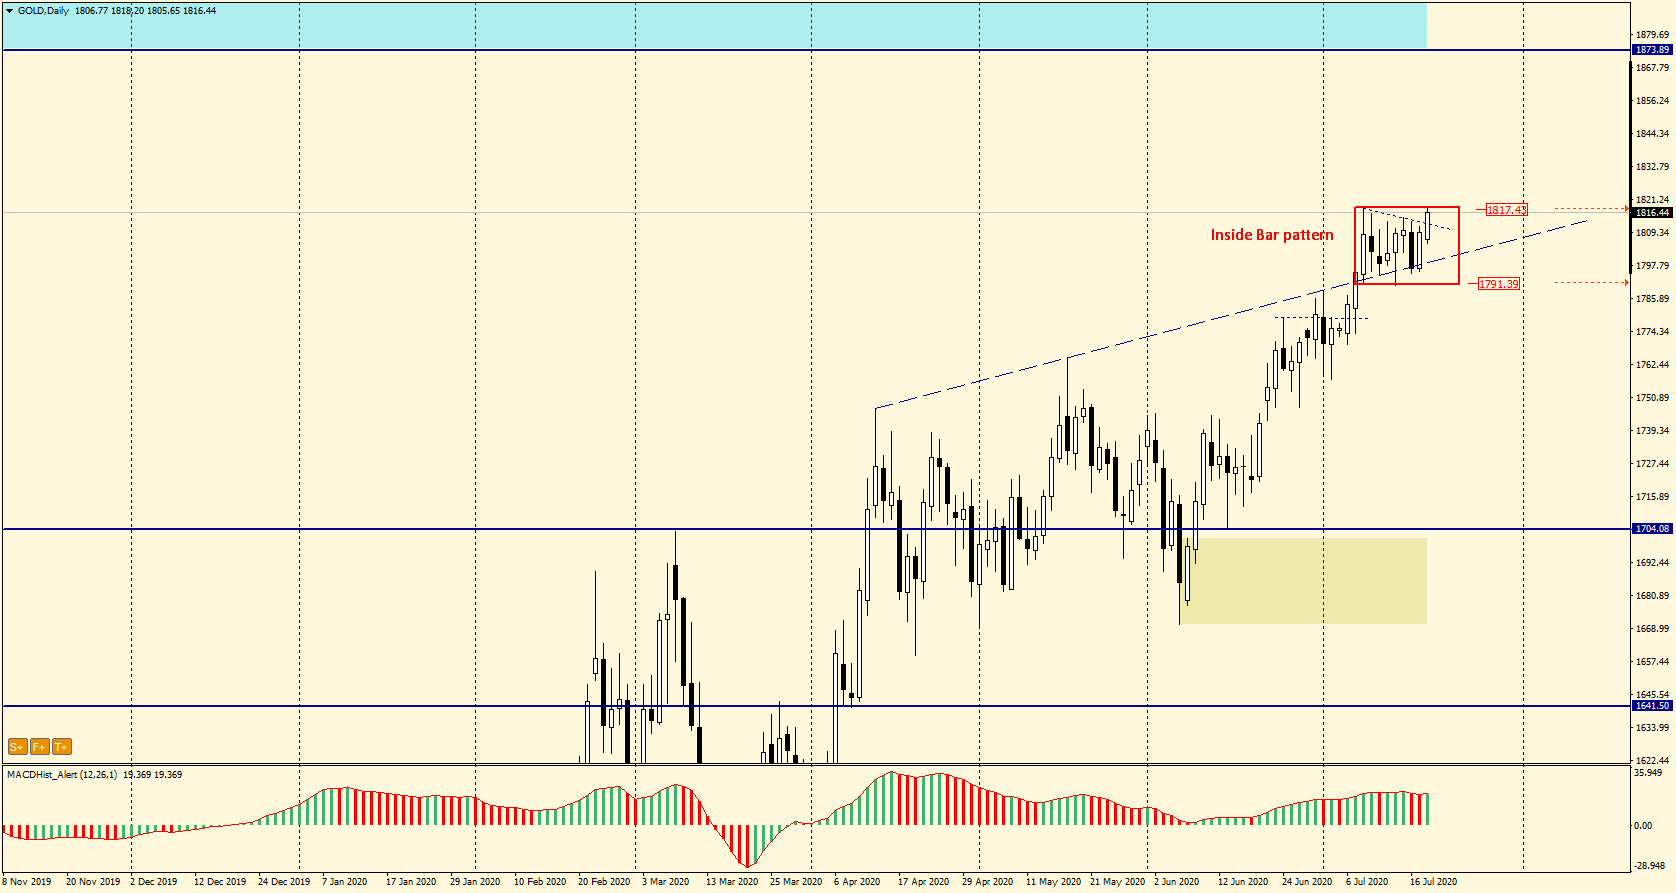
When we look at the daily gold price chart (D1), we notice that since the beginning of this year the price has increased by $340 from 1477 to 1819 per ounce. This is the biggest price movement of this metal in 8 years. And it seems that this is not the last word for gold investors.
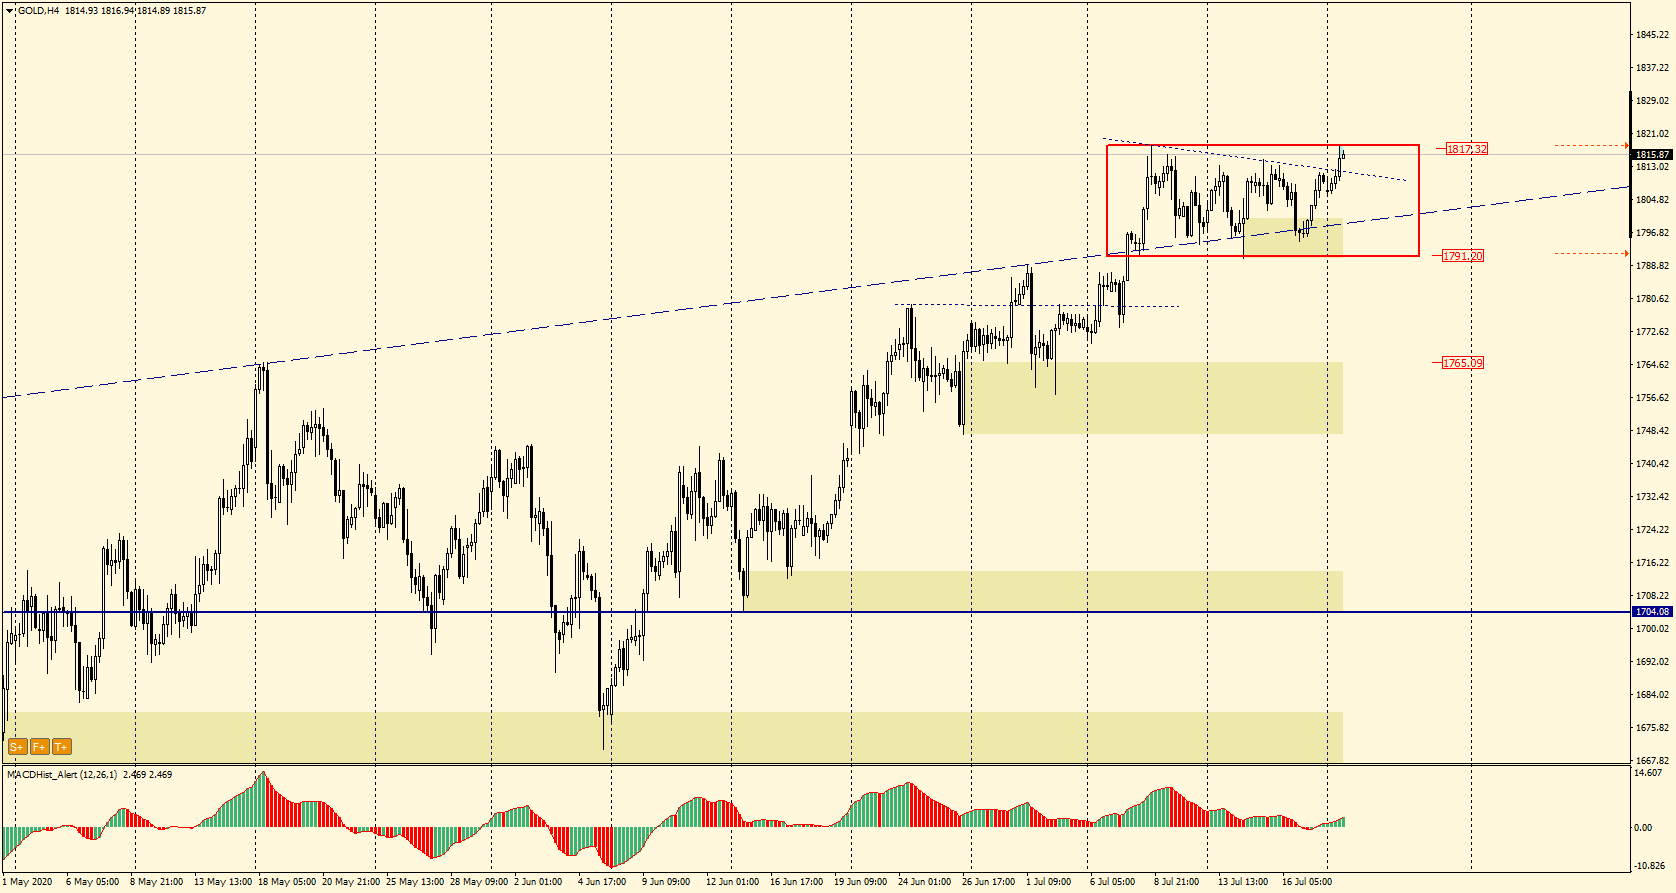
When we look at the H4 chart we notice that for the last two weeks the price has been moving in consolidation creating an inside bar formation. The quotations until today have not been able to break through the range of the day candle of 9.07 forming this formation with a range of 1791-1817 $/oz.
Visit my channel where I post trading ideas: https://t.me/TradewithDargo
In the course of writing this analysis, the price has broken out of this pattern. The MACD oscillator on the daily chart and H4 indicates bullish sentiment.
If by the end of the day the price does not fall below the upper limit of IB= 1818 $/oz we may witness a appreciation of gold, and the target may be the supply zone created in 2011, starting at 1872 $/oz.
If you want to know more about my strategies check this:
– Trading Price Action + MACD – Way to Increase the Probability of Winning
 In our Facebook group, which you can join anytime: https://www.facebook.com/groups/328412937935363/ you will find 5 simple strategies on which my trading is based. There, every day we post fresh analyses of currency pairs and commodities. You can also visit my channel where we can post our trading ideas: https://t.me/TradewithDargo


 Review")


