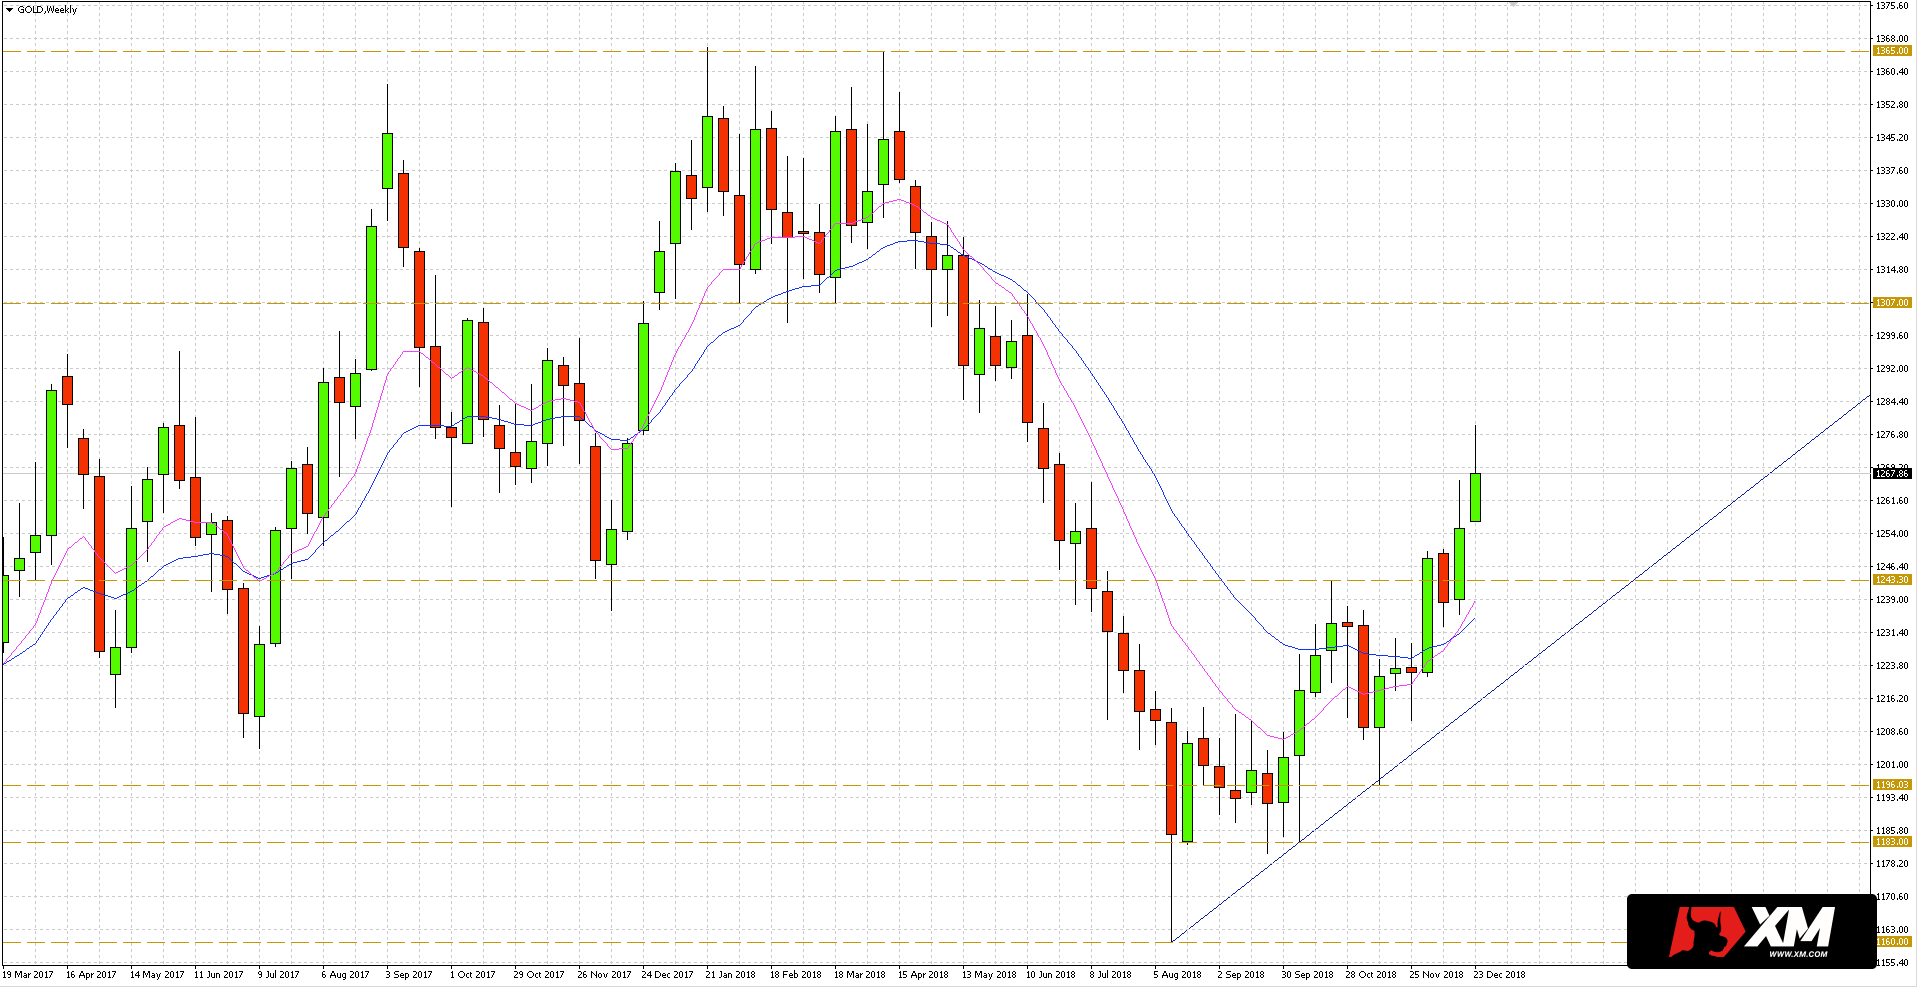
Last week’s GOLD prices remained above 1243.30, which works as support. The October high was also at this level.
This week the course has already established a new maximum, which puts bulls in a privileged position. As the direction of movement has changed to the north, traders can look for buy opportunities.
The daily chart below shows that the price after the breakthrough $1243.30 has moved away from the EMA 10/20 channel, which provides dynamic support. In addition, an accelerated upward trend line from the November low can also provide support.
I trade on this instrument at broker XM, which has in its offer more than 300 other assets >>
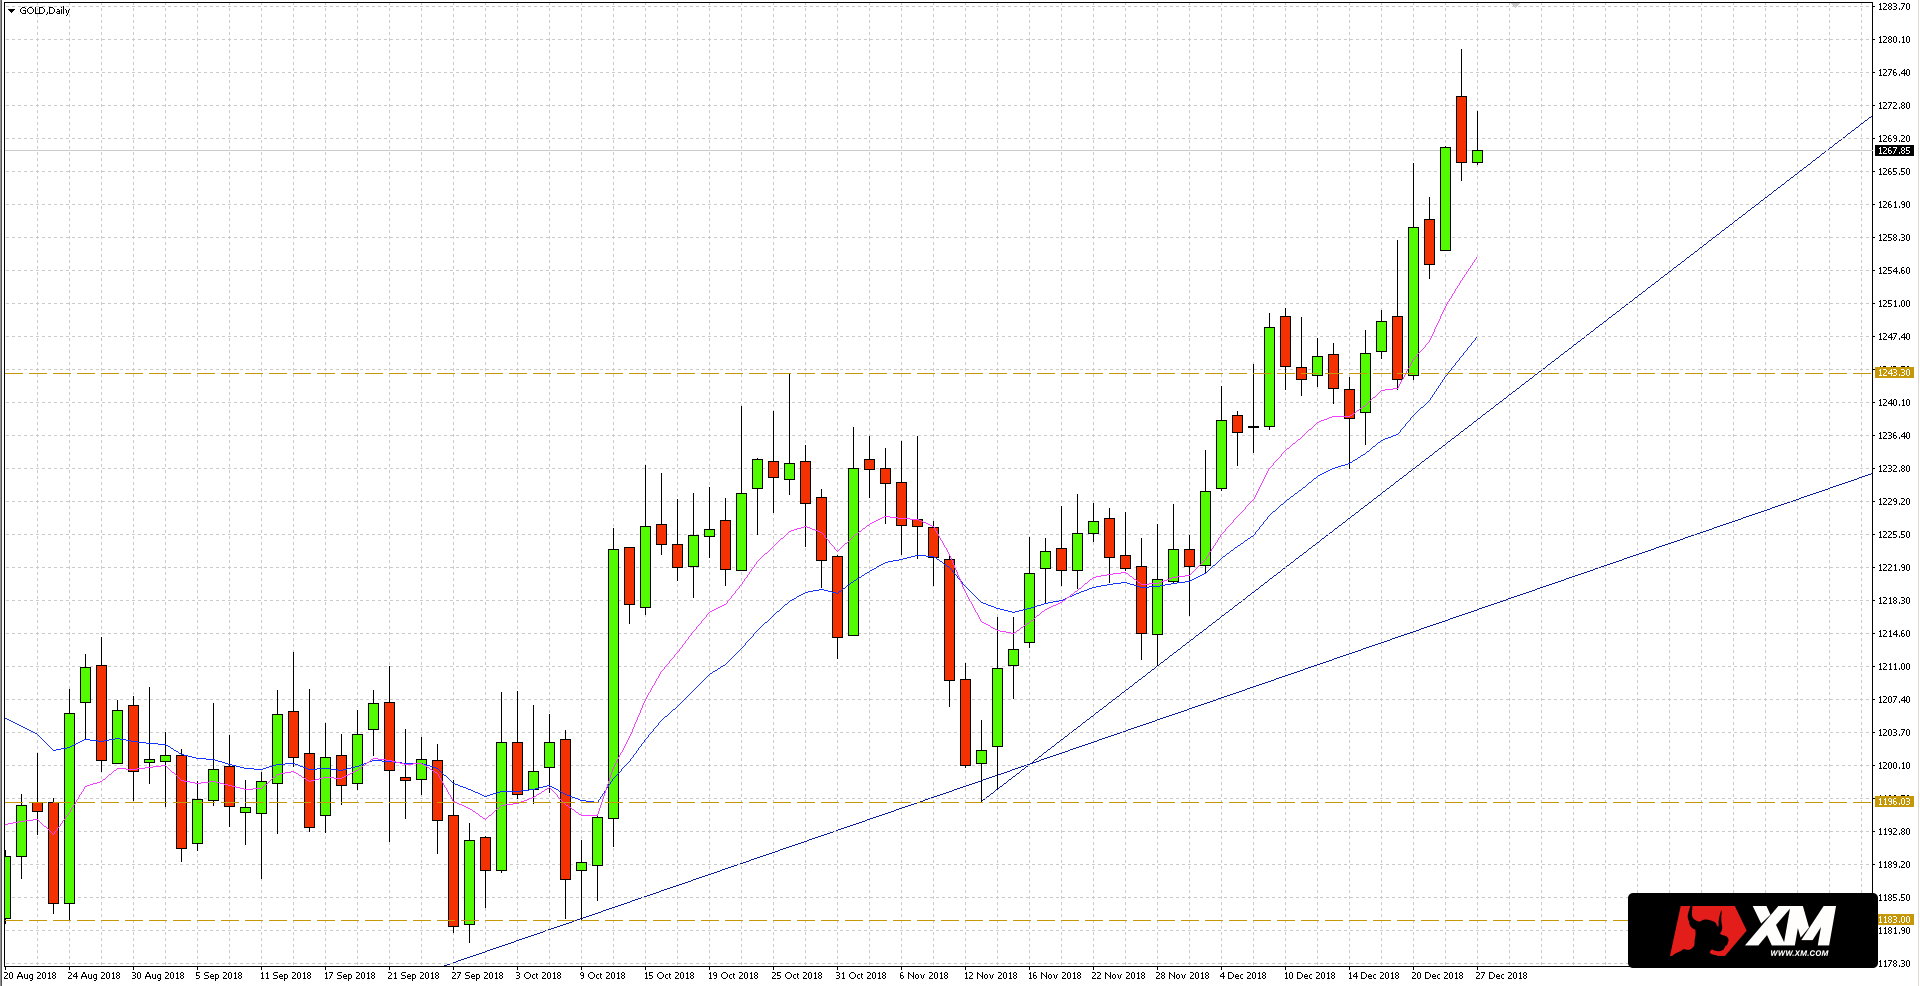
It is around these levels that you will be able to look for buy signals if there is a reversal in the near future. The key growth target is around $1307. This level was a support until May this year, and after the breakthrough, it did very well as resistance.


 Review")


