The last time I wrote about GOLD was on 26.02, when I expected the declines, which actually took place but did not last too long. On Monday, by some people called “black Monday” market brought great volatility, stock indexes lost almost 10%. The NYSE stopped quoting when the drop after opening was 7%. Raw material currencies such as the Australian dollar (AUD) and New Zealand dollar (NZD) also lost hundreds of pips in the first hour after the opening of the Asian markets.
The astonishing thing about this situation was the behaviour of the gold prices which, despite such nervous fluctuations in indices and currency pairs, did not make much movement, and at the end of the day its price rose by only 4 $/oz. This may indicate a decrease in interest in buying this metal at this price.
From Monday to Friday – Live trading at 13:00 (London time) chat, analyse and trade with me: https://www.xm.com/live-player/basic
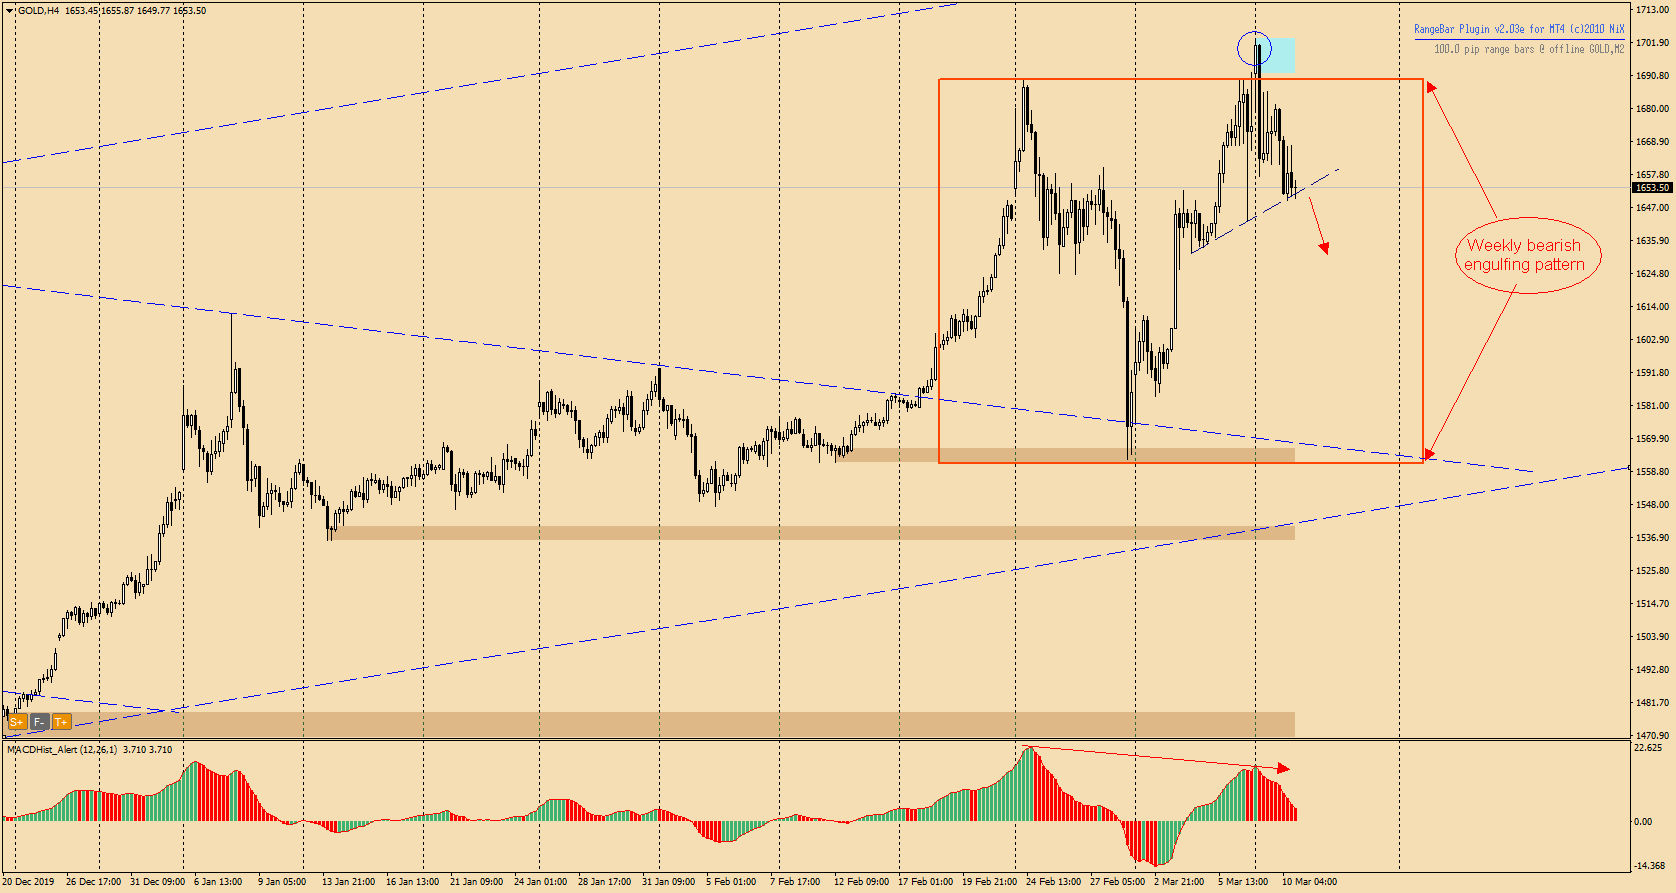
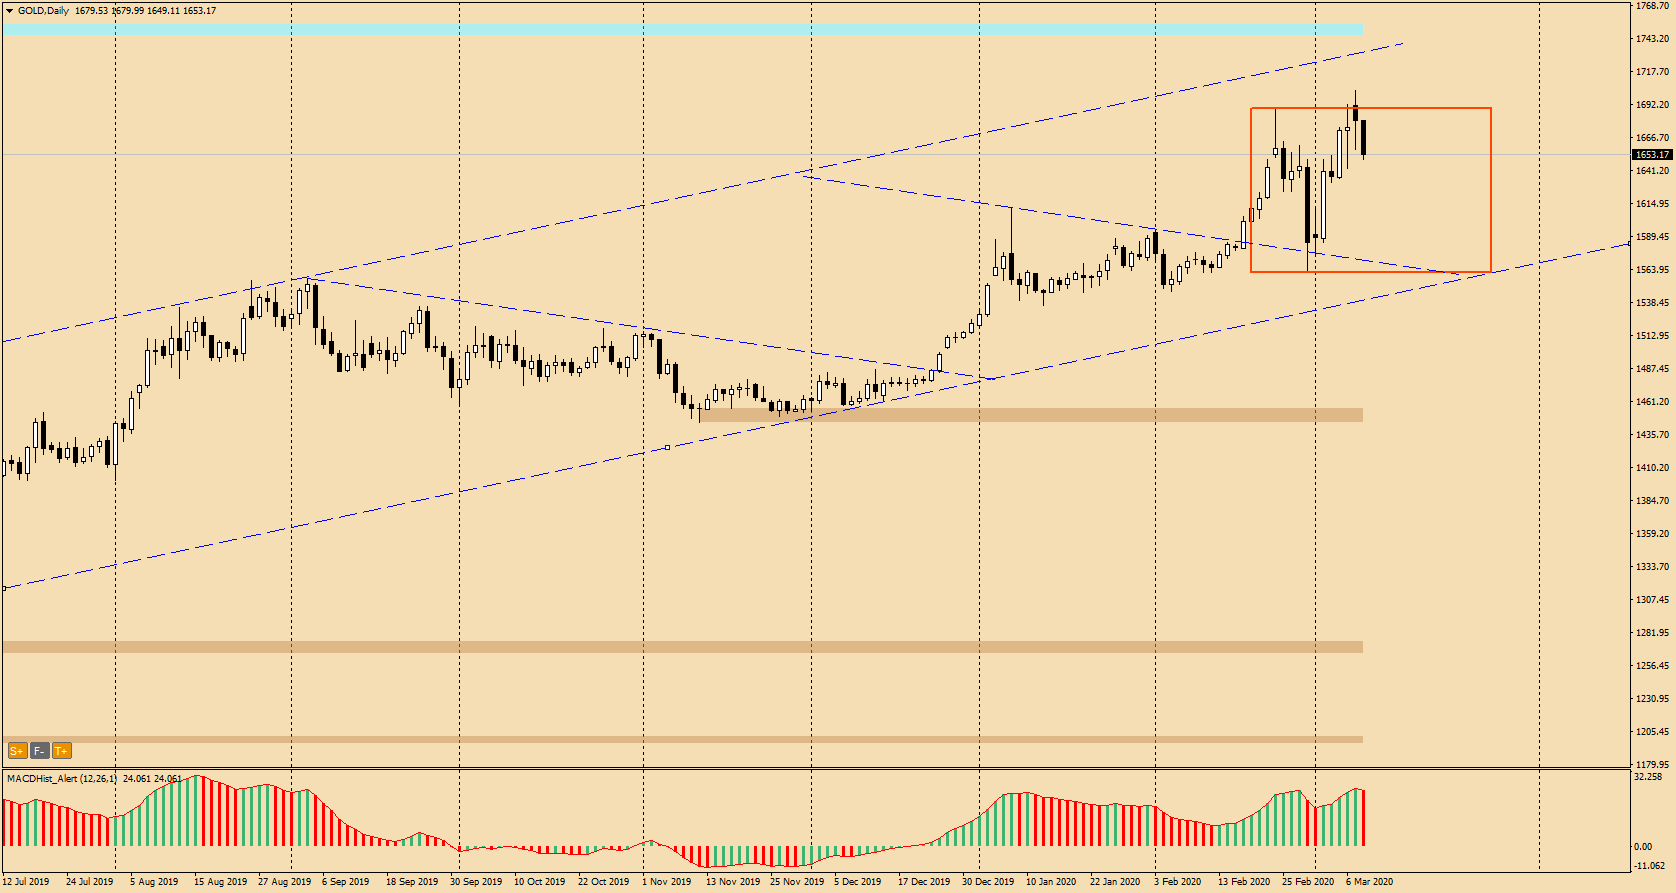
Looking at the chart purely from a technical point of view, we can see that on Monday the price knocked out of the bearish engulfing formation created by the weekly candles, but the day closed inside this formation creating a false breakout (blue marking).
Moreover, when we look at the H4 chart, we see a downward divergence between the MACD and the gold price chart. Currently, the price is on the local trend line which, if overcome, can lead to a downward correction on this instrument.
In our Facebook group, which you can join anytime: https://www.facebook.com/groups/328412937935363/ you will find 5 simple strategies on which my trading is based. There, every day we post fresh analyses of currency pairs and commodities


