The month of July was a record month for GOLD (XAU). The price of this precious metal rose from 1777 to 1982 dollars per ounce, that is 205 $/oz.
The last such an upward trend occurred 9 years ago in July 2011, when the gold set the All-Time-High at 1915 $/oz. Interestingly, the next month, August 2011, was strongly declining and ended with a large downward candle engulfing the July candle.
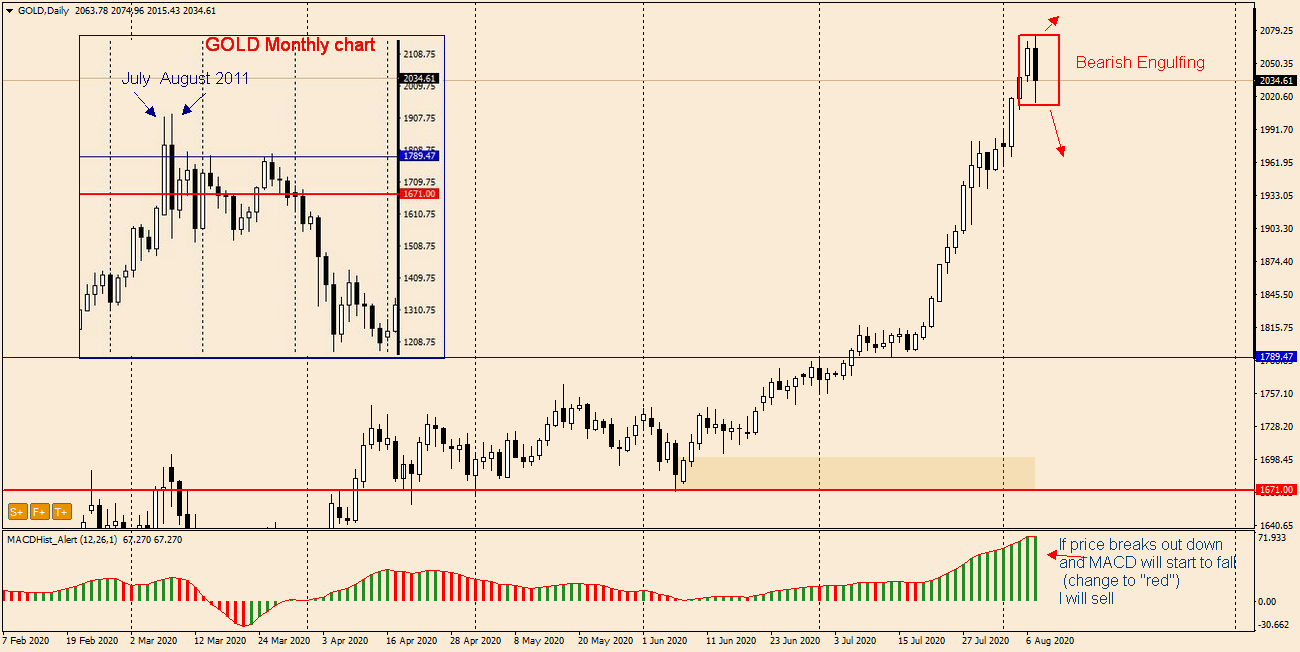
Currently in the daily chart after the next ATH was set at 2077 $/oz there is a bearish engulfing pattern.
If there is a downward breakout and this is accompanied by a declining MACD, this will be a strong signal for a downward correction. Will there be a repeat of the story of 9 years ago – when the gold price dropped sharply after the ATH was established?
Visit my channel where I post trading ideas: https://t.me/TradewithDargo
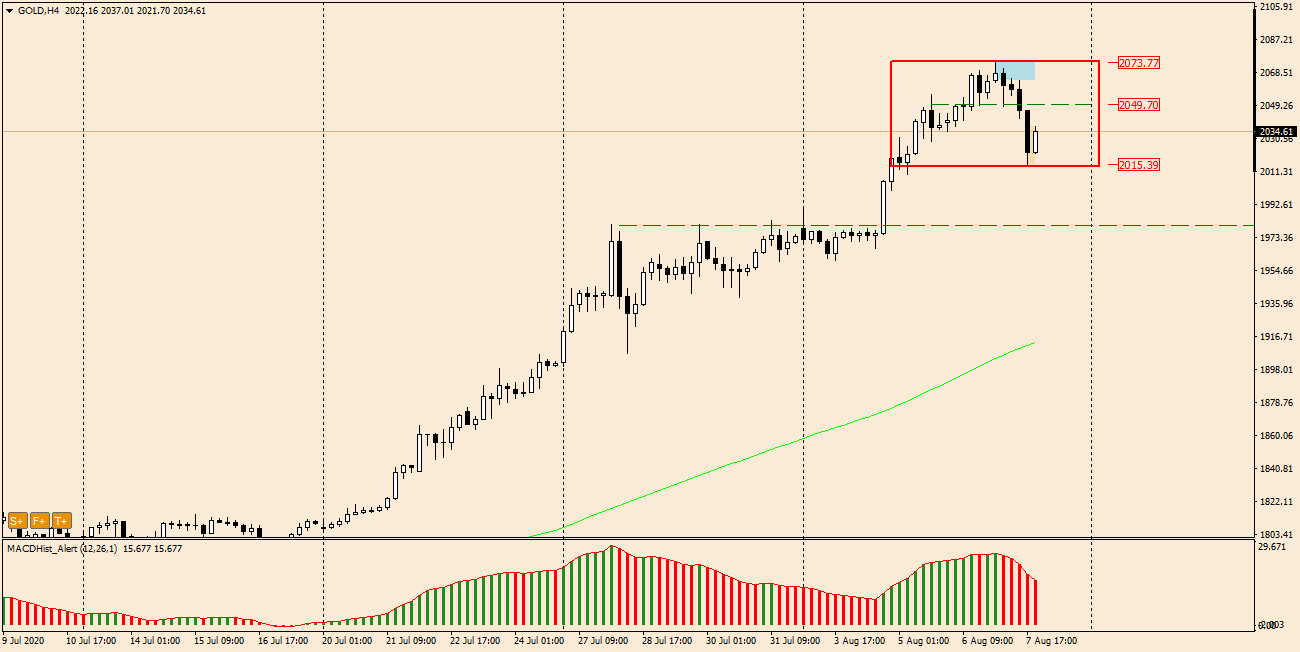
On the four-hour chart H4 the local level of support/resistance (S/R) – 2050 may be a good place to take a short position.
The first supply target after a successful breakthrough the bottom may be 1980 $/oz.
 In our Facebook group, which you can join anytime: https://www.facebook.com/groups/328412937935363/ you will find 5 simple strategies on which my trading is based. There, every day we post fresh analyses of currency pairs and commodities. You can also visit my channel where I post my trading ideas: https://t.me/TradewithDargo


 Review")


