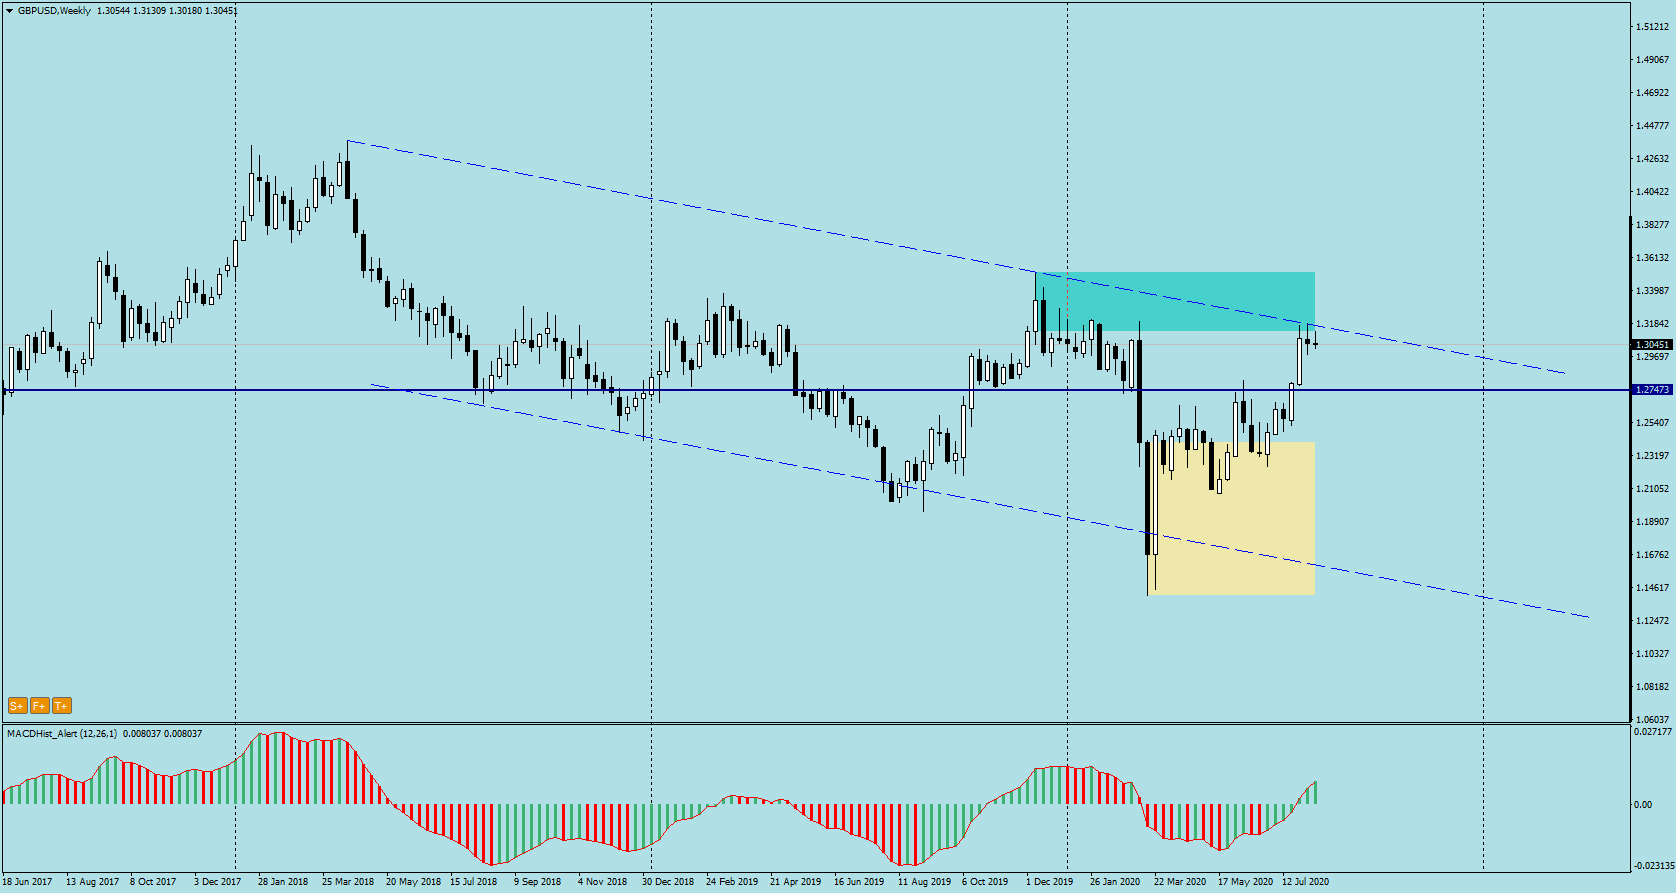
The GBPUSD pair, popularly called the cable, after setting the all-time minimum in March this year at 1.1400, is moving in a strong upward trend.
Last Friday, August 7, the first signs of a downward correction appeared on the weekly chart after reaching the resistance of the long-term downward channel (1.3190). On the daily chart, MACD started to decrease for the first time in 2 weeks.
When we move on to the hourly chart (below), we notice the characteristic silhouette of the H&S formation. It can be considered that both arms and head were finally shaped. The neck line is marked in green:
Visit my channel where I post trading ideas: https://t.me/TradewithDargo
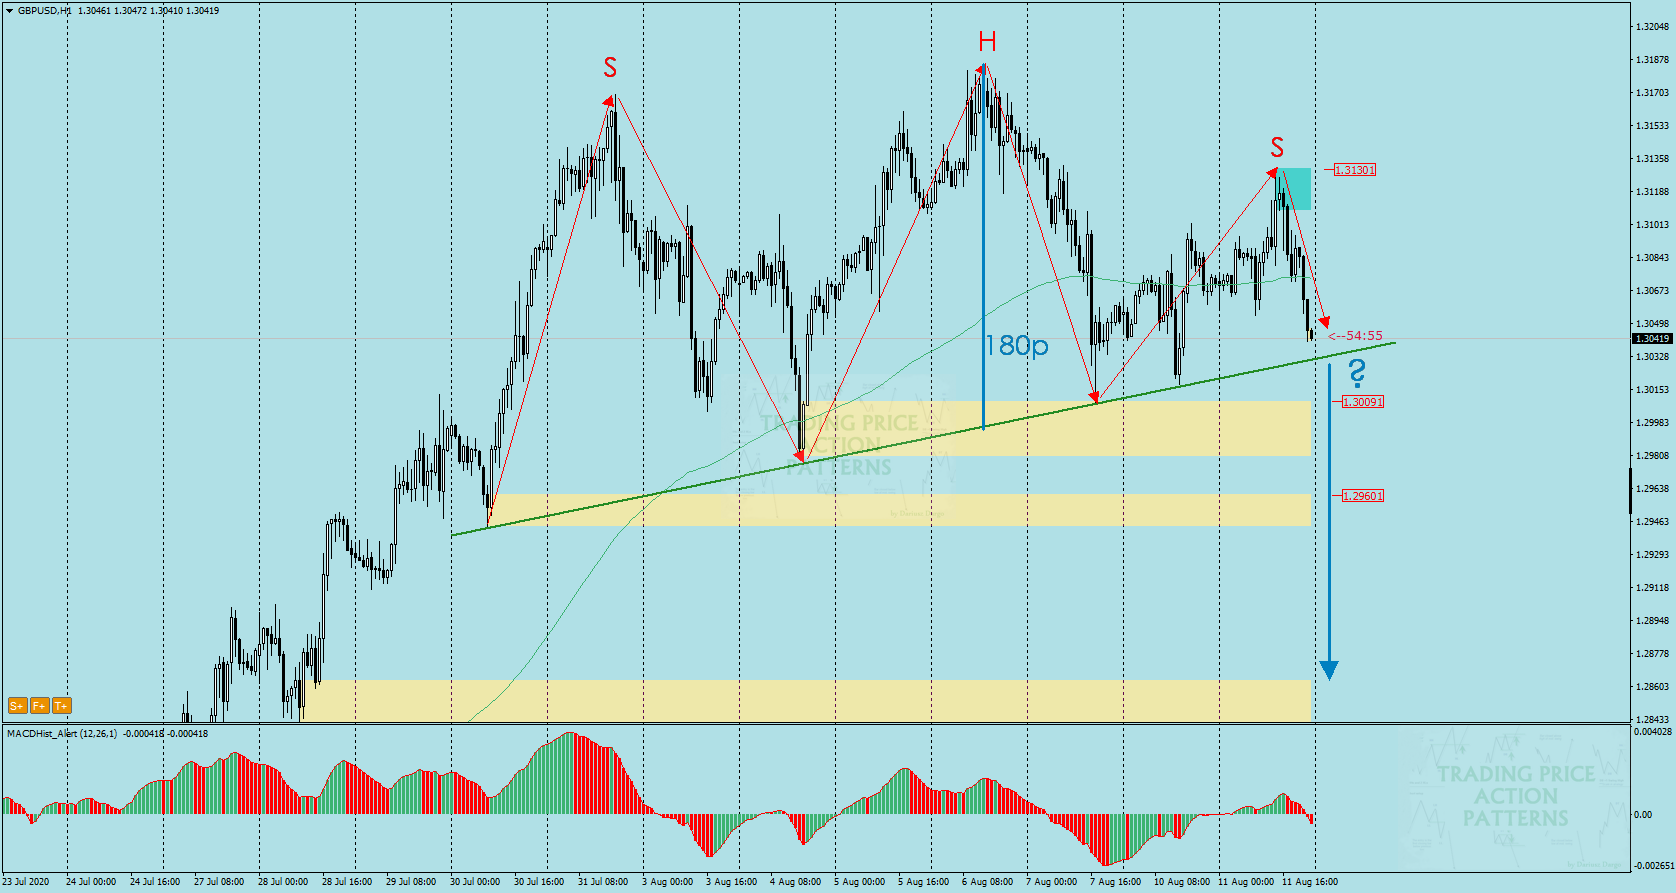
The question is whether after reaching the neck line the price will break it, or whether it will turn back and GBPUSD will return to increases. The possible declines about 180p
It is worthwhile to observe the behaviour of the price in the area of the mentioned neck line and in case of its successful overcoming, try to open Sell positions. The best opportunity would be a possible re-test of the defeated neck line from the bottom.
Don’t forget about fundamentals…

Tomorrow there is a lot of data in the economic calendar that could affect this pair, especially the value of GDP, so be careful and do not open orders directly before publishing the data.
 In our Facebook group, which you can join anytime: https://www.facebook.com/groups/328412937935363/ you will find 5 simple strategies on which my trading is based. There, every day we post fresh analyses of currency pairs and commodities. You can also visit my channel where I post my trading ideas: https://t.me/TradewithDargo


 Review")


