Looking at the recent strongly volatile quotations on most instruments one could say that analysing charts from the point of view of technical analysis has little chance of proving to be an effective method and at present only a fundamental approach counts. However, I still believe that this is not the time to abandon TA and I will try to answer the question from the title of this analysis.
GOLD 15.03.2020
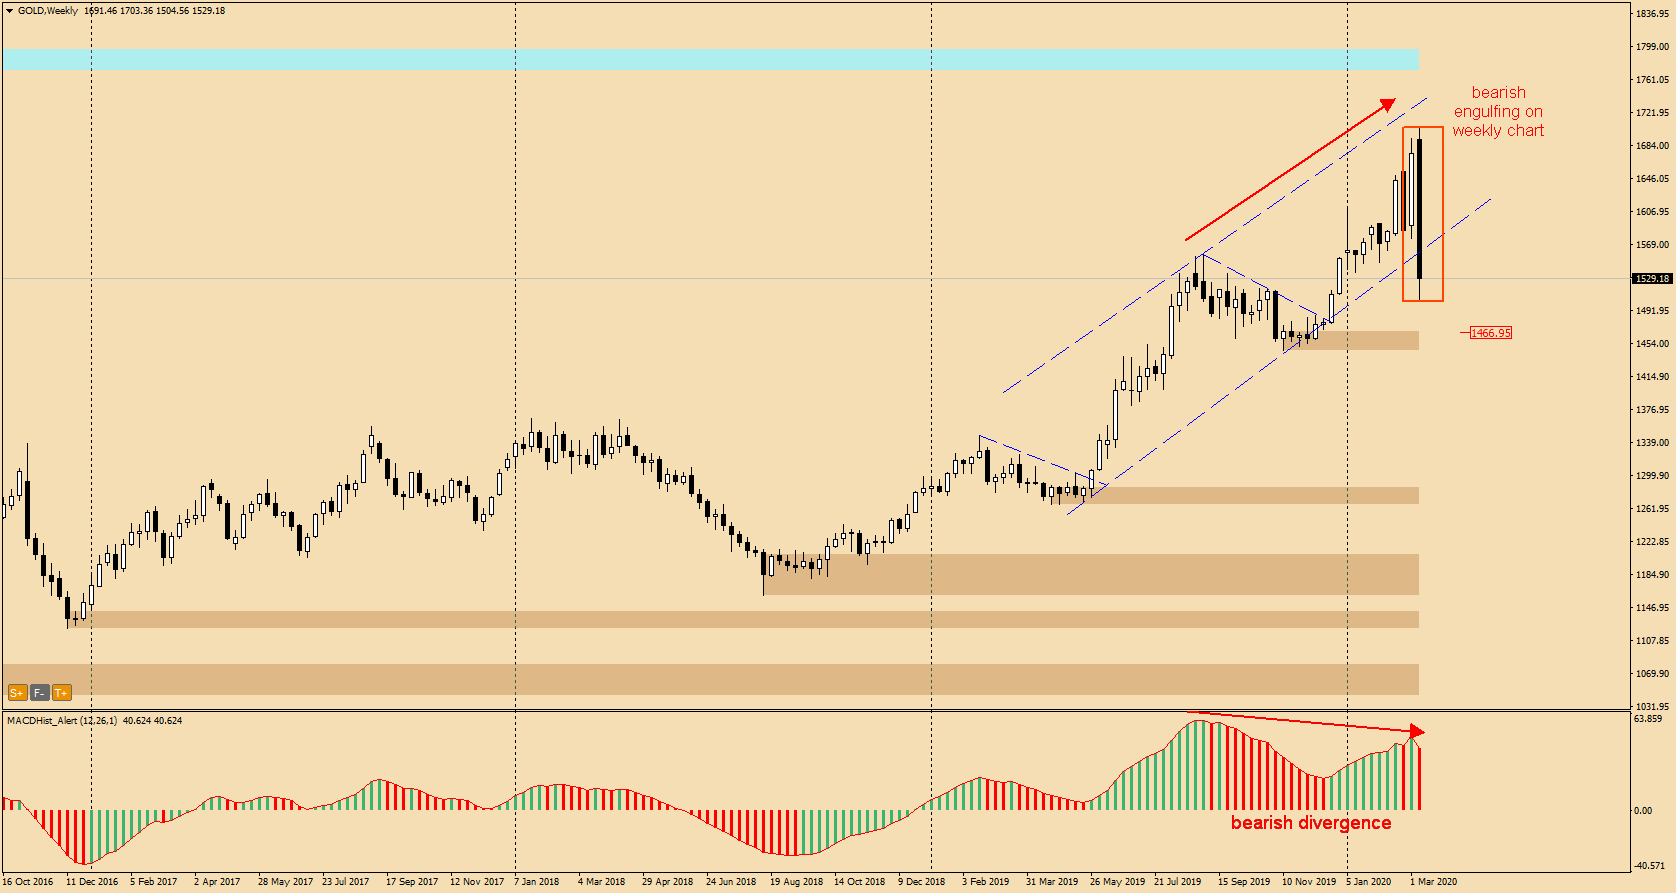
Last week I analyzed Gold and in the weekly summary in the last sentence I risked a statement based on the technical situation on the chart that this is not the end of the declines on this metal… In a couple of sessions we will see if the next bearish engulfing on the weekly chart and the accompanying strong downward divergence showed me the right direction (south) for this instrument.
From Monday to Friday – Live trading at 13:00 (London time) chat, analyse and trade with me: https://www.xm.com/live-player/basic
USDJPY 15.03.2020
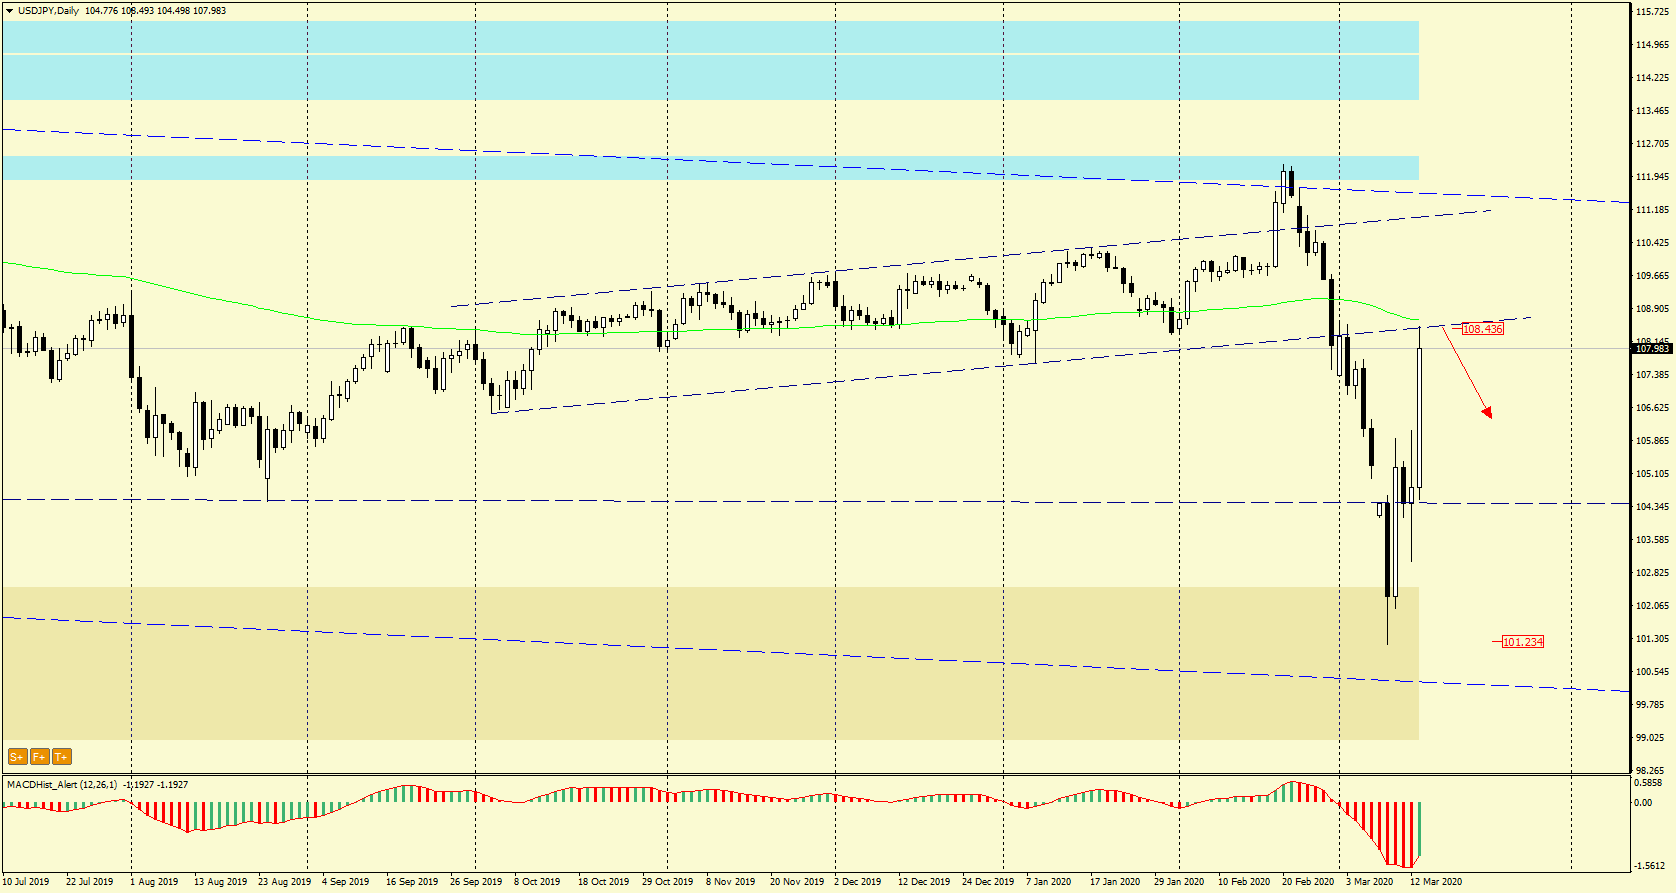
But let’s move on to the USDJPY… what can you turn out of the chart here? At the beginning of March, the price broke out from the upward channel and fell significantly to 101.20. At the end of last week, the decreases were recovered and on Friday we witnessed a re-test of the defeated support of the channel, which now serves as a resistance.
The global situation indicates that there is a risk-off sentiment, which means escaping from risky investments to safe havens… which would indicate that after the re-test of the channel from below we will witness another wave of falls on the USDJPY pair, which would mean the strengthening of the Japanese Yen.
In our Facebook group, which you can join anytime: https://www.facebook.com/groups/328412937935363/ you will find 5 simple strategies on which my trading is based. There, every day we post fresh analyses of currency pairs and commodities


 Review")


