A week ago (20.10) the price of the EURAUD pair set the maximum of this month at 1.6828. The quotation on the following day was in the range of the preceding candle creating a two-candle formation – inside bar.
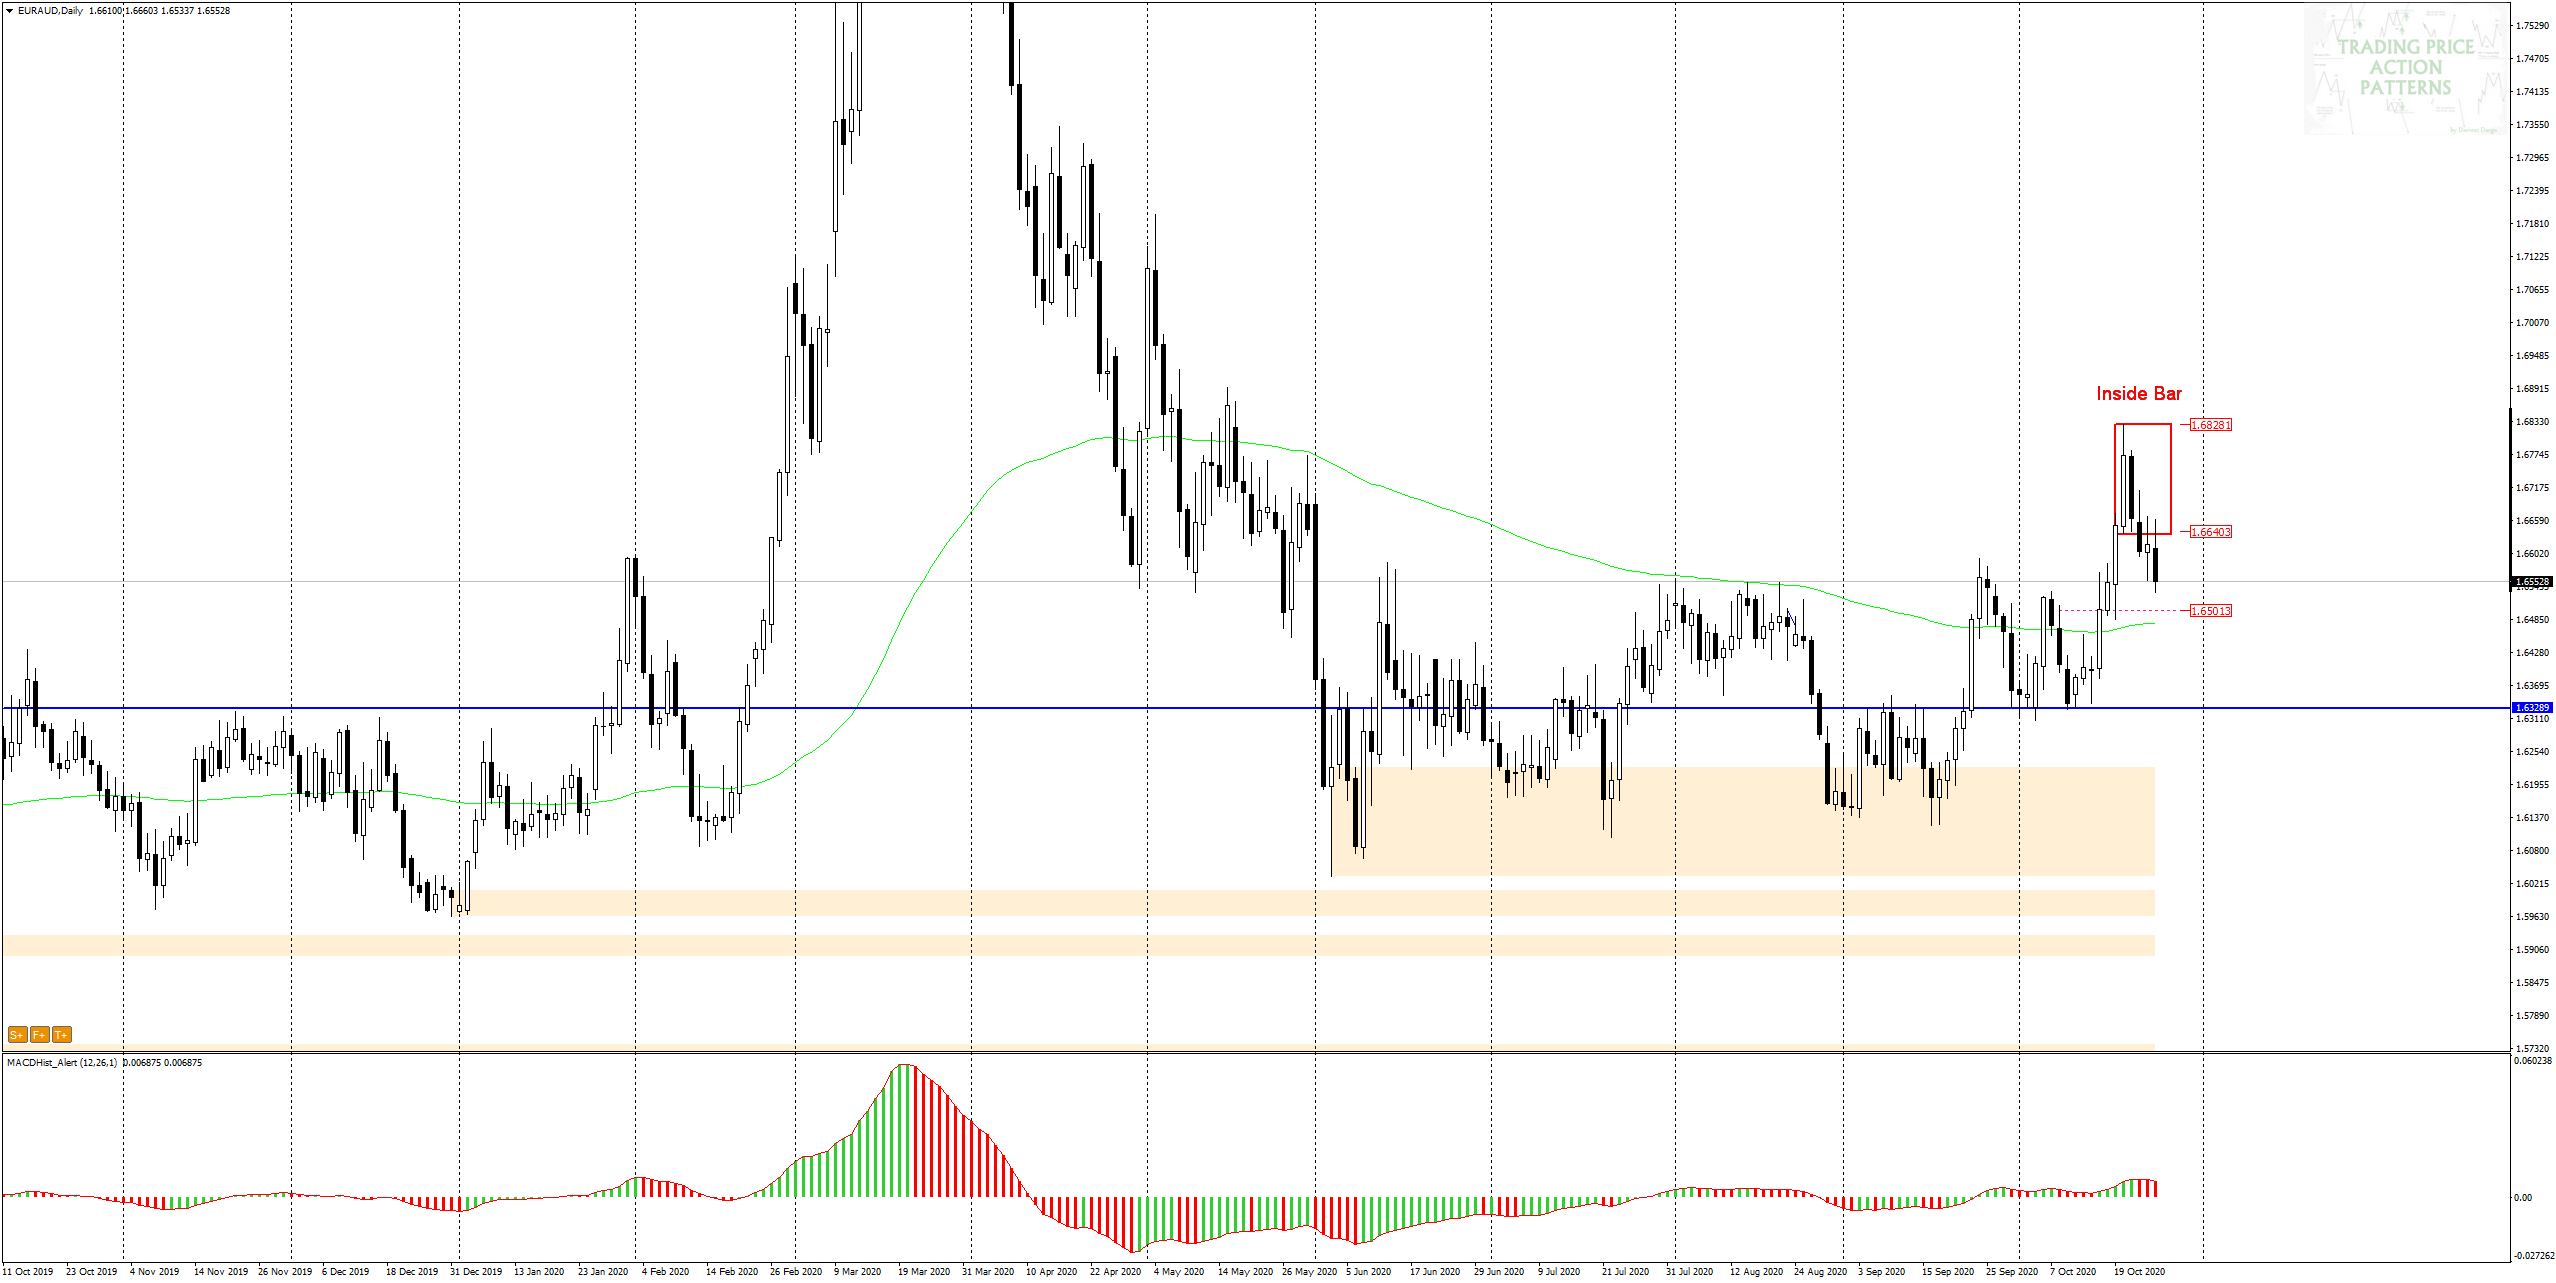
The quotations of the next day led to the breakdown from the formation and after several attempts to retest the defeated bottom level of the formation, the price is heading south.
In the H4 chart we can see the characteristic silhouette of the H&S formation (Head&Shoulders). The line drawn through the last two minima forms a neck line. H&S is a trend reversal formation, and crossing the neck line is often a signal for declines.

The course of today’s quotations indicates a high probability of continuation of the declines initiated during the Asian session. The most convenient place to take the sell position would be retest of the neck line… If it happens…
The first supply target may be a demand zone at 1.6500. A decrease in the order volume should be taken into account, as this is a highly volatile pair and movements exceeding 200p per day are not uncommon.
I also recommend:
Trading with PA+MACD, or how to increase the probability of winning
ongoing analysis https://t.me/TradewithDargo
 In our Facebook group, which you can join anytime: https://www.facebook.com/groups/328412937935363/ you will find 5 simple strategies on which my trading is based. There, every day we post fresh analyses of currency pairs and commodities. You can also visit my channel where I post my trading ideas: https://t.me/TradewithDargo


 Review")


