EURUSD
You can read Ichimoku strategy description here.
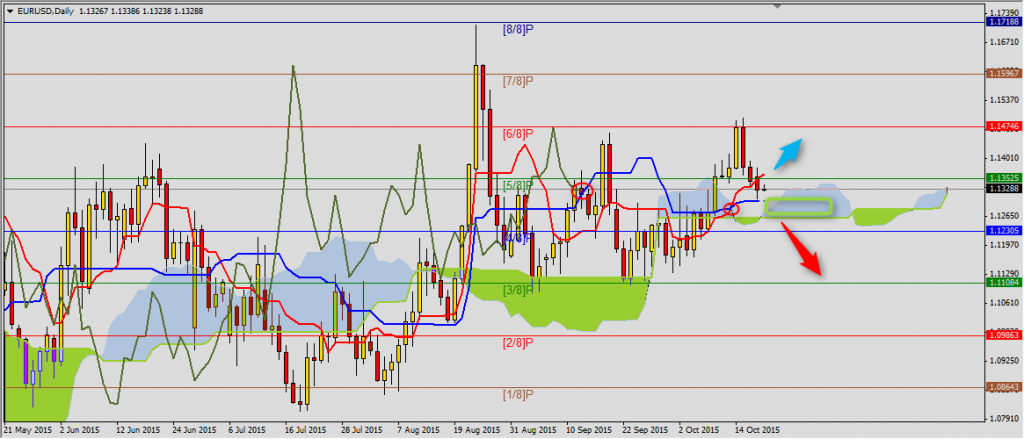
Ichimoku lines on EURUSD inform us about lack of confidence around investors about further moves on this pair. In last two months Kumo changed color five times already and despite the fact Chikou Span stays above chart we shouldn’t be sure about continuation of growth on this pair. For now resistance is at Tenkan-sen 1.1364 and support is Kijun-sen 1.1300, price is currently moving in this direction. Then we have cloud bottom 1.1260 and close of daily chart below this level will mean going back to (3/8)P 1.1109. From the other side breaking Tenkan-sen resistance will generate another buy signal.
USDCAD
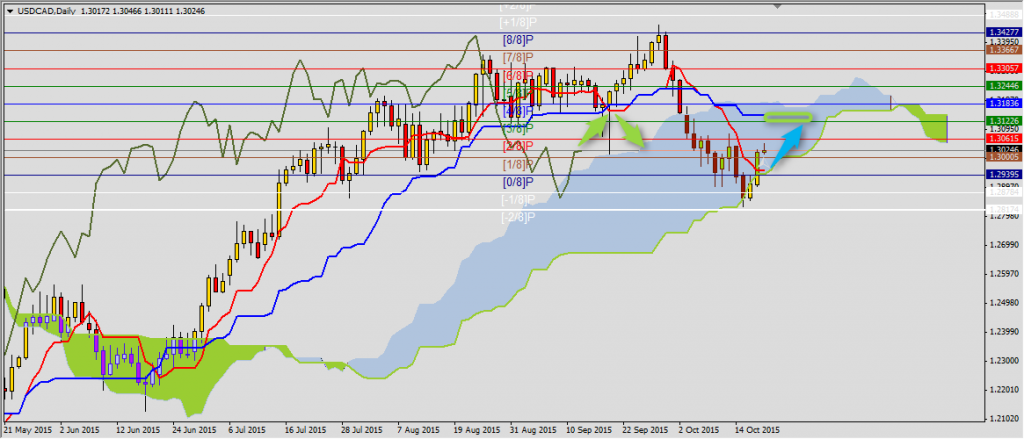
USDCAD sets local low at 1.2831 after breaking Tenkan-sen 1.2955. This level is now a support, in case correction will be continued. Next resistance is at (3/8)P 1.3122 and Kijun-sen 1.3144. You should remember that target level of this bearish trend phase is Kijun-sen 1.2690 on weekly chart, where breaking Tenkan-sen will be a signal of continuation of decreases.
YOU CAN TRADE USING ICHIMOKU STRATEGY WITH FREE FXGROW ACCOUNT.
NZDUSD
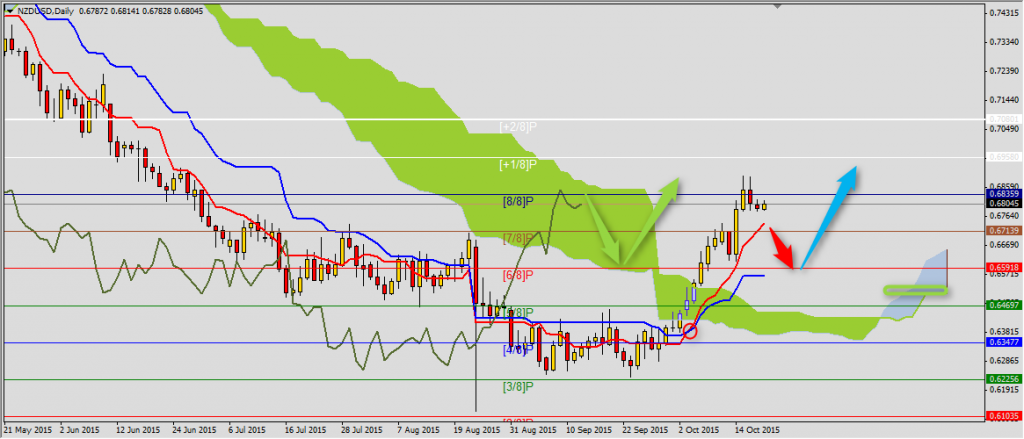
Bullish trend on NZDUSD slowed down and price is again getting closer to (8/8)P 0.6836 resistance. However price breaking bearish Kumo often means going back to Kijun-sen 0.6566 and breaking TEnkan-sen 0.6740 support will be a signal of correction here. Bullish trend stays safe in this case unless price stays above Senkou Span B 0.6509. The range of this move is Kijun-sen 0.6932 on weekly chart.


