GBPUSD
You can read Ichimoku strategy description here.
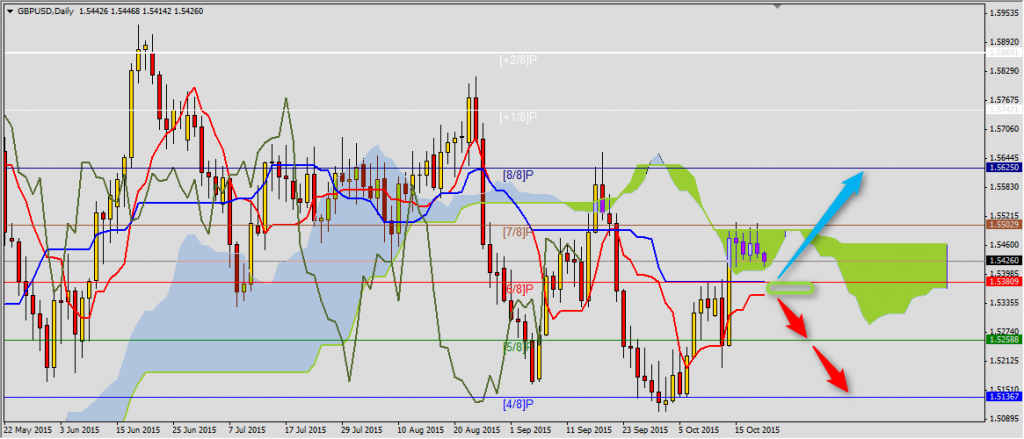
The pair couldn’t break resistance (7/8)P 1.5503 and price is getting closer to support area 1.5382-1.5354 set by Kijun-sen and Tenkan-sen. Decrease below these levels will generate another sell signal, where range is set by another Murrey lines 1.5259 and 1.5137. From the other side GBPUSD staying above this area ad Senkou Span B 1.5462 will be a sign of coming back to (8/8)P 1.5625. However Ichimoku lines still suggest first bearish scenario.
USDCAD
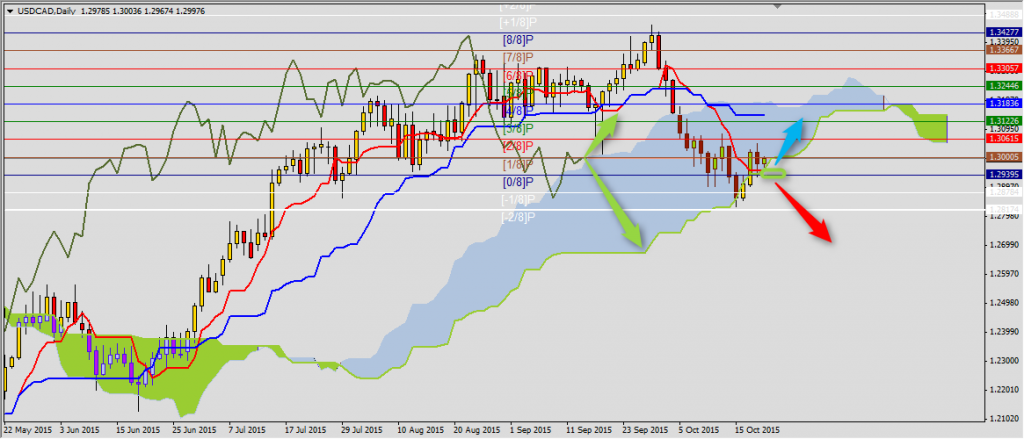
Yesterday there was defense of support area 1.2955-1.2939. It is Tenkan-sen and line (0/8)P and price staying above these levels will mean correction to Kijun-sen and (3/8)P 1.3122-1.3144. Close below this area will be a signal of continuation of bearish trend to Kijun-sen 1.2688 on weekly chart.
YOU CAN TRADE USING ICHIMOKU STRATEGY WITH FREE FXGROW ACCOUNT.
AUDUSD
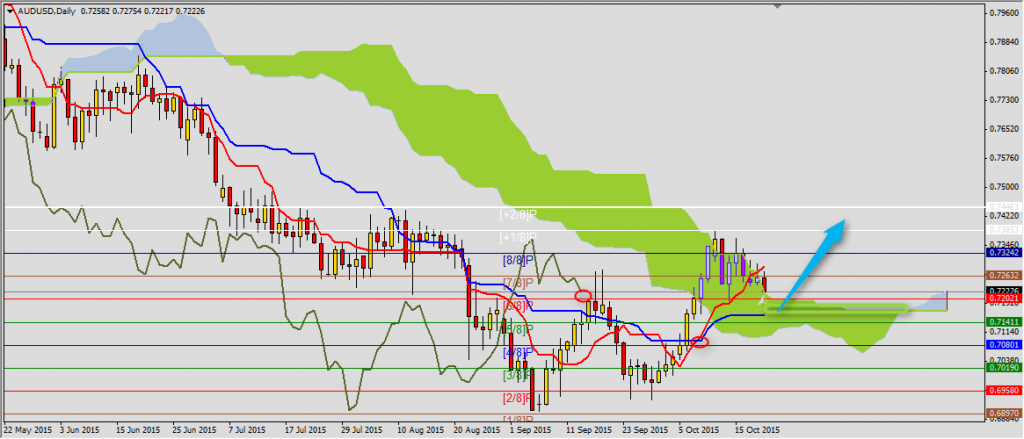
AUDUSD is getting closer to support area 0.7172-0.7158 which is set by Senkou Span B and Kijun-sen. Aussie staying above these levels is a condition of the pair coming back to bullish trend in nearest sessions. The range stays Kijun-sen 0.7533 on weekly chart.
NZDUSD
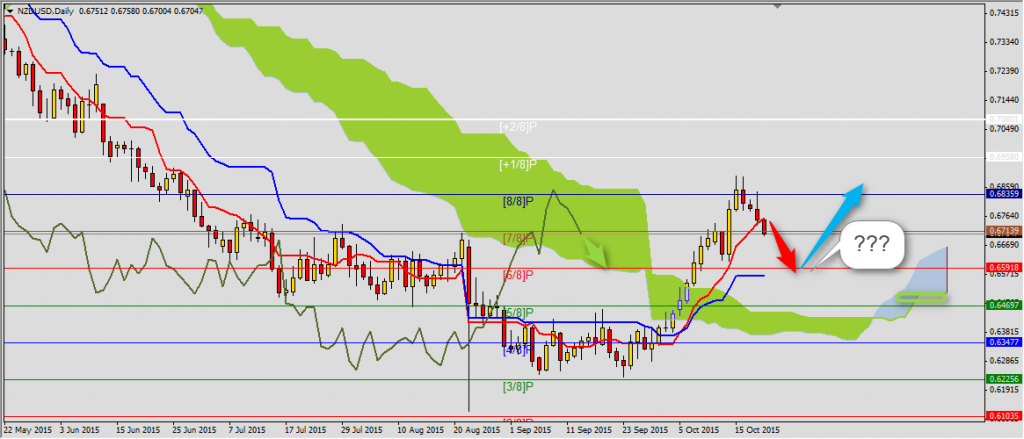
Similar situation there is on NZDUSD. Here resistance is set by Tenkan-sen 0.6757 and opening of daily candle below this level is a signal of correction of last bullish trend and range in this case is second balance level Kijun-sen 0.6566. Unless price stays above Senkou Span B 0.6509 there is still possibility of coming back to weekly Kijun-sen 0.6933.


