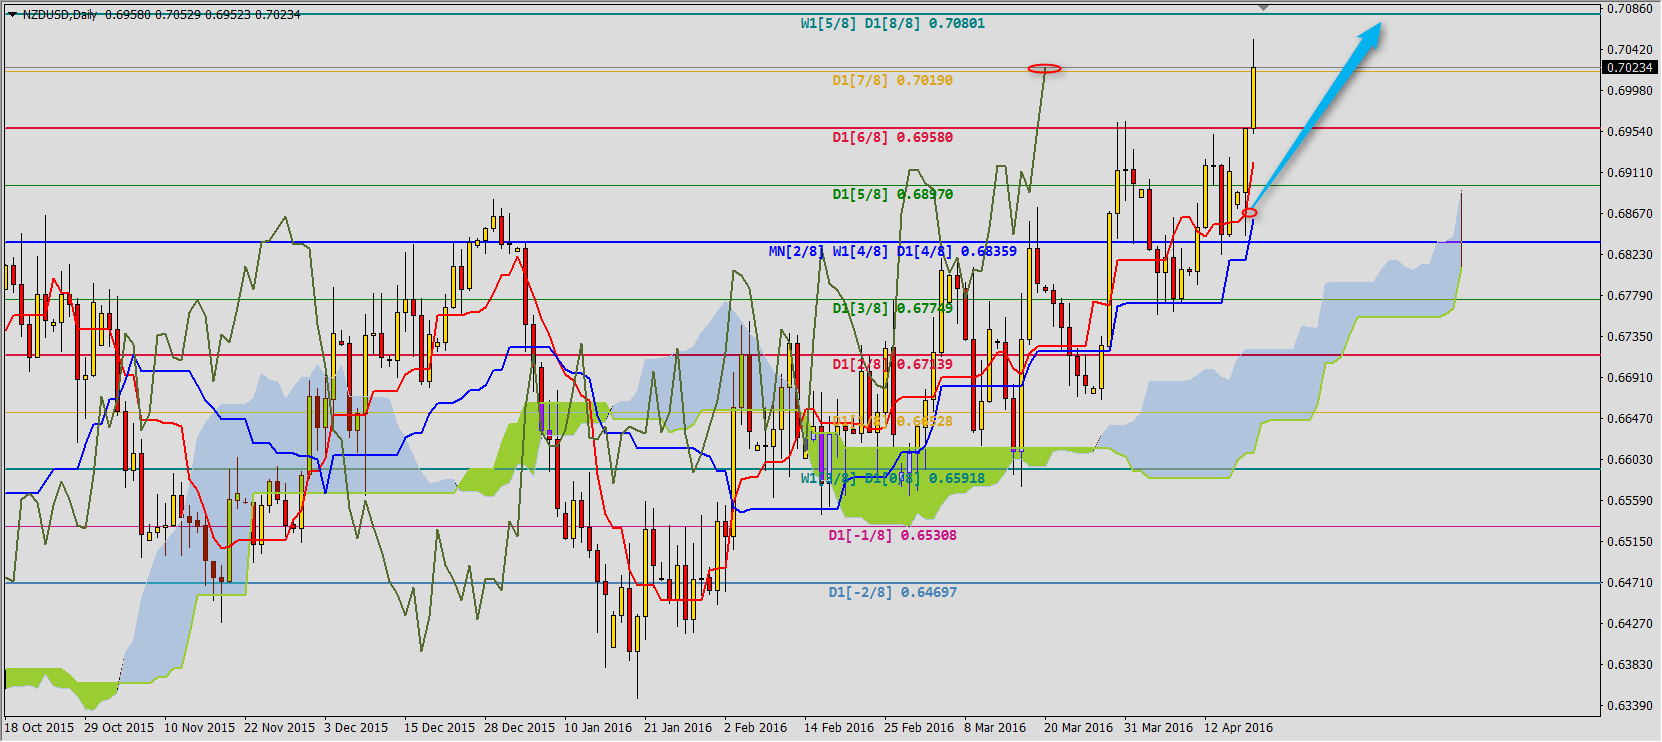
NZDUSD
On Monday after breaking Tenkan-sen 0.6865 resistance first buy signal was generated. The chart is getting close to first range of this phase of bullish trend, level (8/8) 0.7080. It is worth to notice that buliish trend on Kiwi is disturbed by strong corrections: after two-three sessions of gains there is dynamic decrease. The closest support level is set by Tenkan-sen 0.6922.
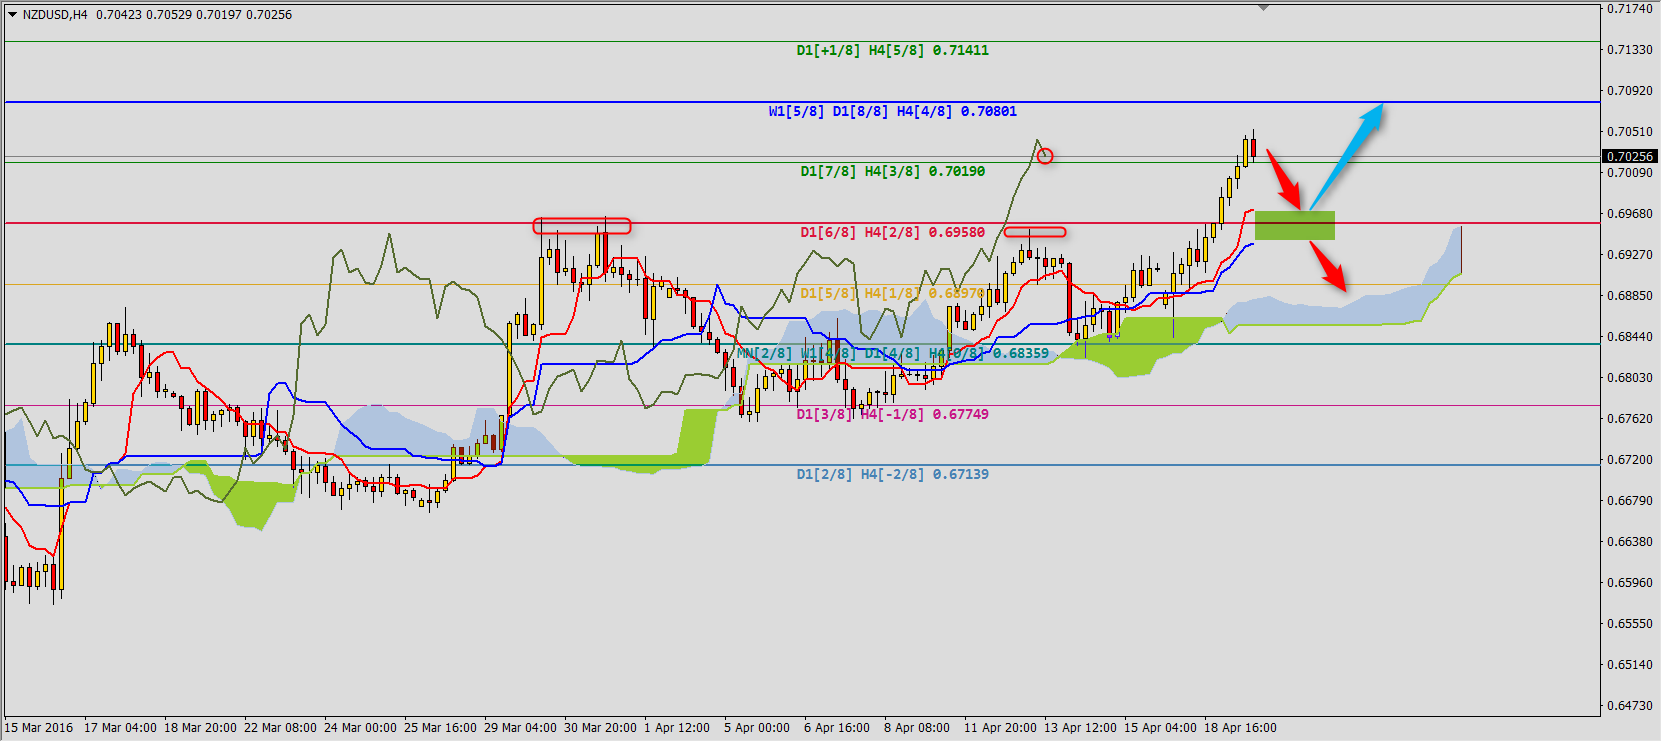
For better view we should change to H4 chart. Here support area is set by Tenkan-sen 0.6972 and Kijun-sen 0.6938. As long as chart is above these levels bullish trend should be continued. The range is set by another Murrey lines 0.7080 and 0.7141. On H4 chart we can see wave structure of last gains on NZDUSD where 4 bullish clouds are crossed by 3 bearish ones.
You can read Ichimoku strategy description here.
EURGBP
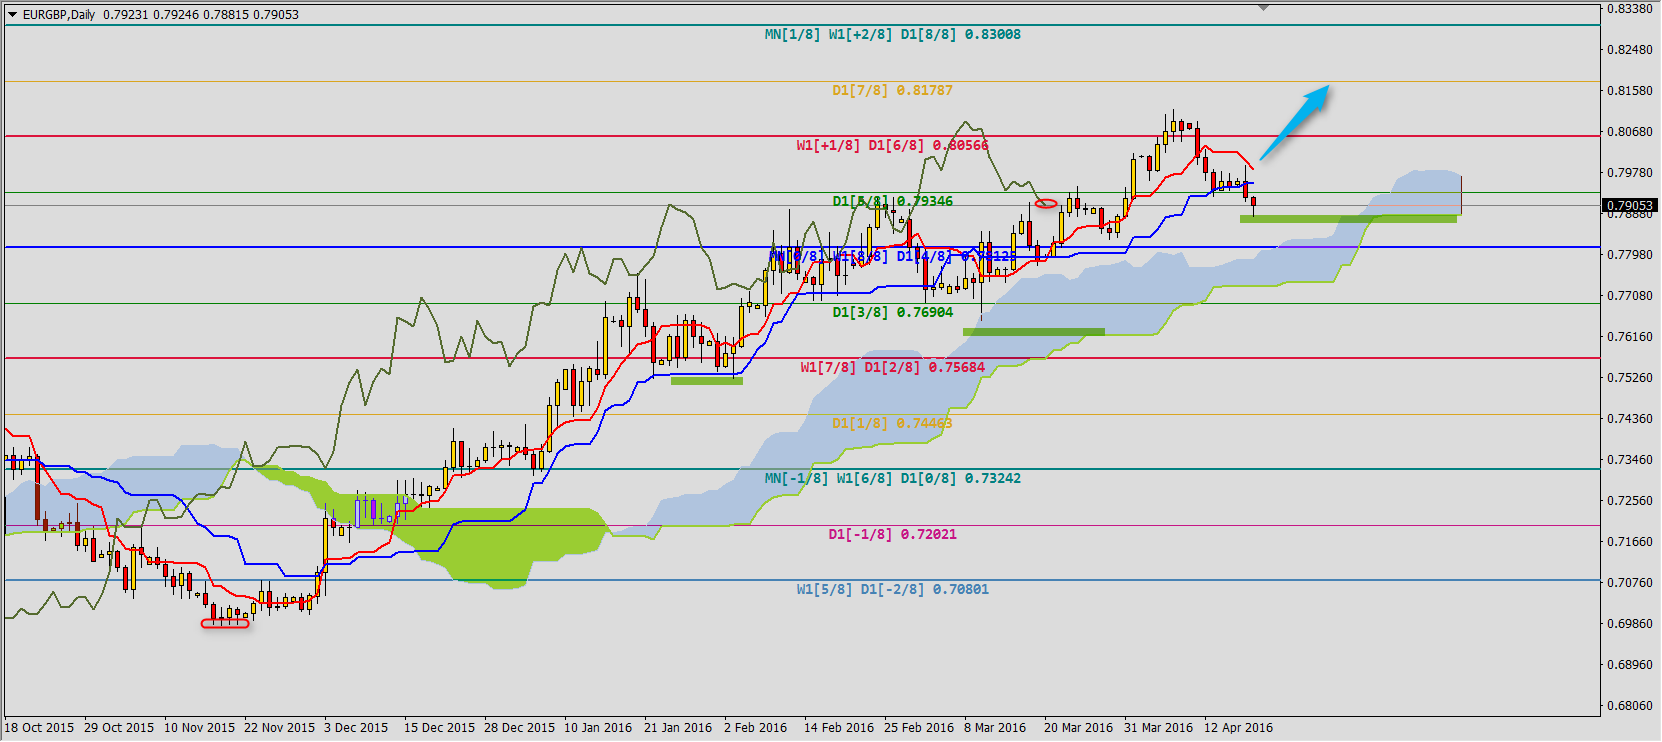
Decreases stopped on very important place – Senkou Span B 0.7884. If we take a look at the chart of this pair we can see that since beginning of bullish trend in the end of November 2015 all corrections stopped on Kijun-sen or Senkou Span B. If this sequence should be continued breaking Tenkan-sen 0.795 will be a buy signal to 0.8187 or even 0.8300. Decrease below today’s low (and especially below (4/8) 0.7812) will be a signal of setting local high on EURGBP.
YOU CAN TRADE USING ICHIMOKU STRATEGY WITH FREE FXGROW ACCOUNT
GBPJPY
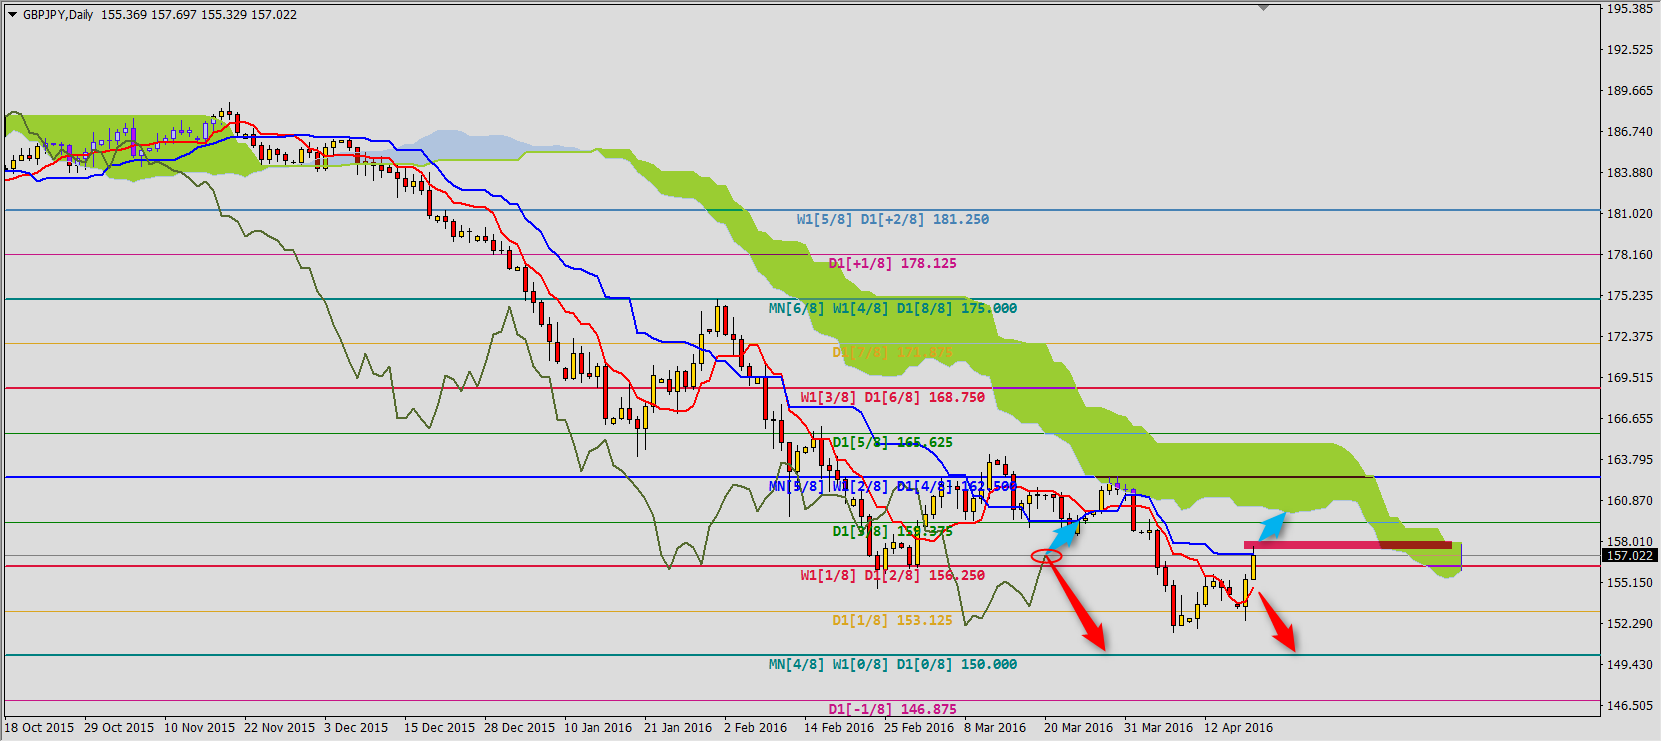
After setting low at 151.63 correction started, it should reach Kijun-sen 157.10 and Senkou Span B 157.86 resistance area. If the cahrt will break Tenkan-sen 154.82 support we will see another sell signal with range (0/8) 150.00. However if Senkou Span B will be broken it will mean bigger correction of bearish trend.


 Review")


