USDCAD

You can read Ichimoku strategy description here.
Correction of bearish trend reached to resistance (4/8)P and Kumo top 1.3184, but maybe it isn’t the end of gains on this pair. We clearly see reversed H&S pattern with neck line 1.3039 tested on October 23rd. Range should be set by next Murrey lines 1.3245-1.3306. Support is now Kijun-sen and Senkou Span B 1.3144 and (3/8)P 1.3122. Although Chikou Span stays below chart but setup of next candles let us confirm scenario above. Drop of USDCAD below support area will be a sign af price going back to Tenkan-sen 1.3014.
AUDUSD

This pair for 7th session cannot close above Tenkan-sen 0.7272 what confirms how serious this resistance is. Chikou Span is above the chart but still has place to decrease what can initiate another test of support area Kijun-sen 0.7158 and line (5/8)P 0.7141. As long as AUDUSD stays above this area the most probable scenario is price going back to Kijun-sen on weekly chart 0.7533. First we can have some time of consolidation connected with price being above bearish Kumo.
YOU CAN TRADE USING ICHIMOKU STRATEGY WITH FREE FXGROW ACCOUNT.
USDJPY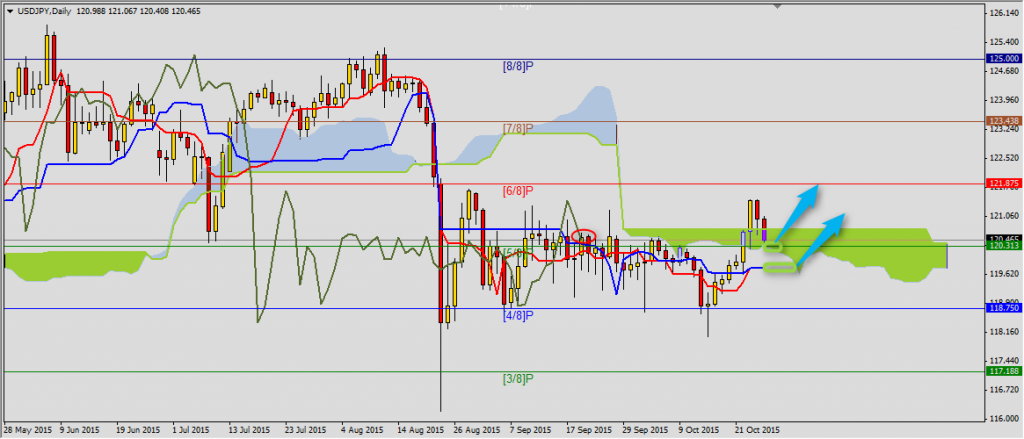


Right now USDJPY comes back to the middle of consolidation and Senkou Span 120.38. Chikou Span is at support and it is important to keep bearish tendency in this area. A little lower there is (5/8)P line 120.31 and USDJPY staying above this area will mean another attack on the line (6/8)P 121.88. Strong support level is set by horizontal Tenkan-sen and Kijun-sen 119.77.


 Review")


