USDCAD
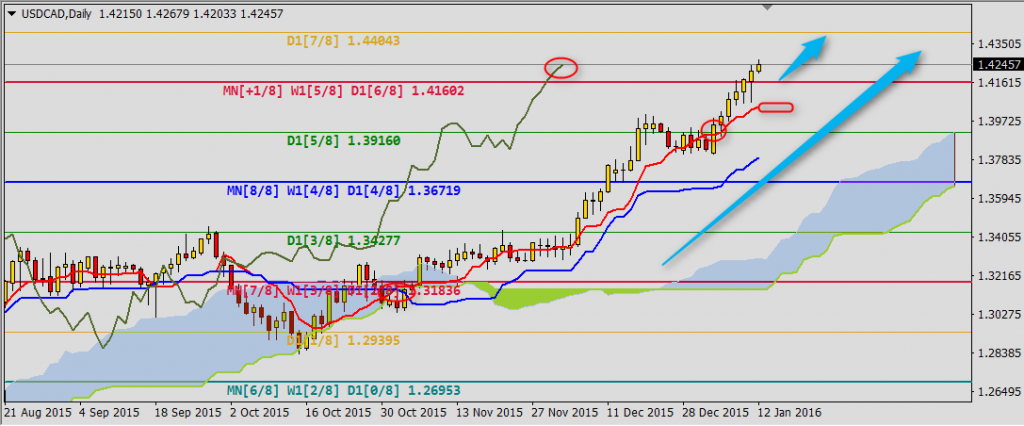
Bullish trend on USDCAD accelerated after last phase of consolidation which ended with breaking Tenkan-sen and (5/8)P line 1.3916. All Ichimoku lines confirm buy signal and first support today is one line higher (6/8)P 1.4160 and resistance is set by (7/8)P 1.4404.
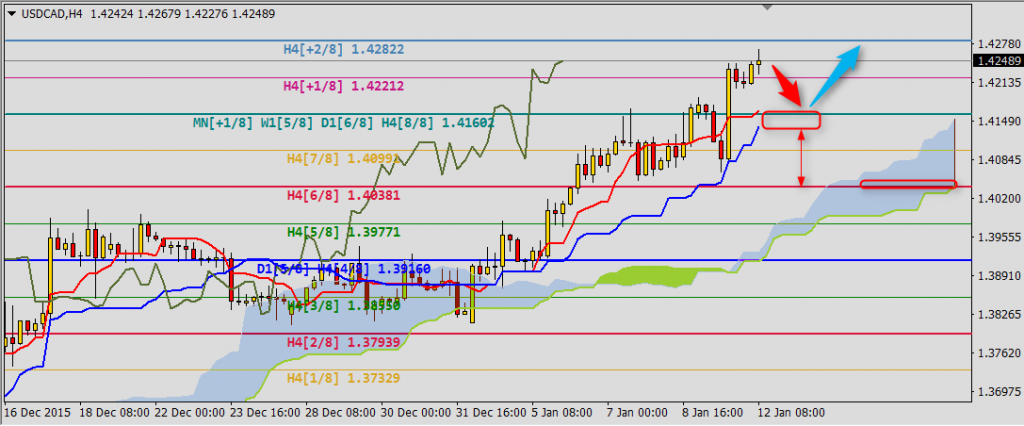
To understand better situation on this pair let’s take a look at H4 chart. Here we can see support area 1.4160-1.4138 created by Tenkan-sen and Kijun-sen. Breaking resistance 1.4282 will open the road to 1.4404 mentioned above. However if price will break Kijun-sen support it will be a sign of bigger correction to Senkou Span B and (6/8)P line 1.4038.
EURUSD
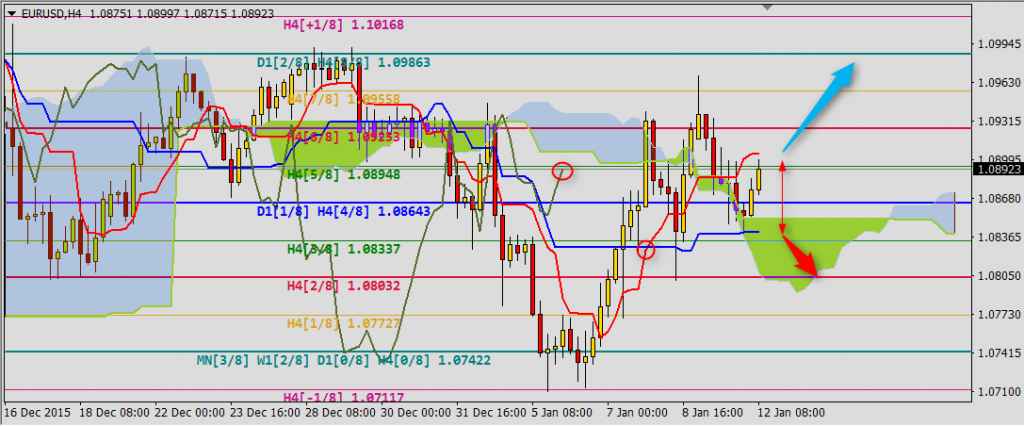
Continuation of side trend. Price is moving between Kijun-sen supports 1.0841 and Tenkan-sen 1.0905 on H4 chart. Breaking Tenkan-sen resistance will be a sign of continuation of gains to (8/8)P line 1.0986. Decrease below Kijun-sen will be a signal of going back to Kumo bottom and (2/8)P line 1.0803. Chikou Span is above the chart and Ichimoku lines but Kumo is bearish what can inflict longer term of consolidation.
NZDUSD
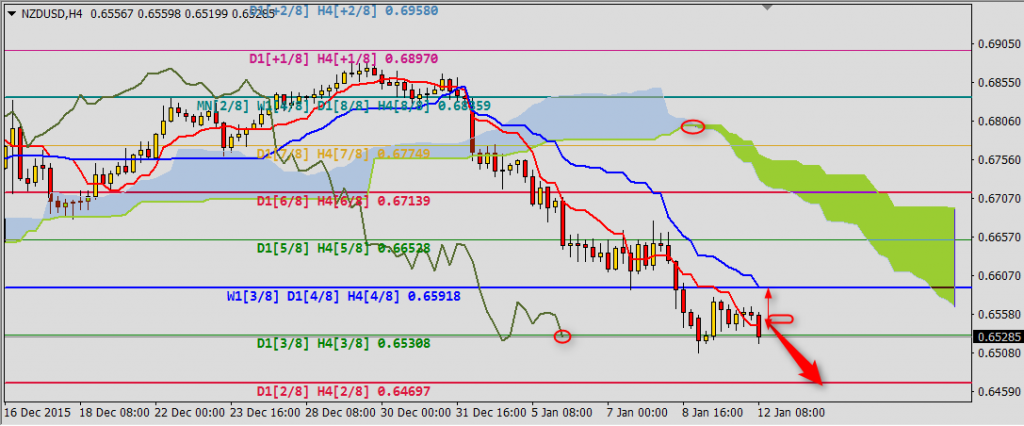
We can see another sell signal generated on H4 chart after decrease of price below Tenkan-sen 0.6543. It is a signal of three lines (price<TS<KS<SSA). If this setup will be kept today, we can expect continuation of decreases to another Murrey line 0.6470. Price going back above Tenkan-sen will be a signal of correction to Kijun-sen and (4/8)P 0.6592.


