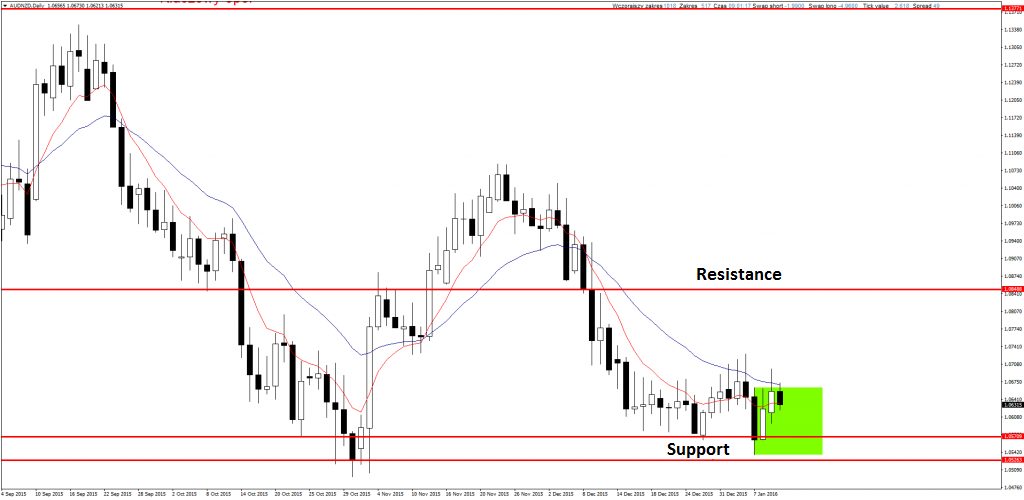
AUDNZD
Yesterday I was waiting for breaking from Inside Bar pattern. Eventually there was false break above, but we cannot play this setup because we are just above support and parameters of transaction are not good. Now I will look for long setup, only when support will be broken sentiment will change to bearish and I will look for shorts.
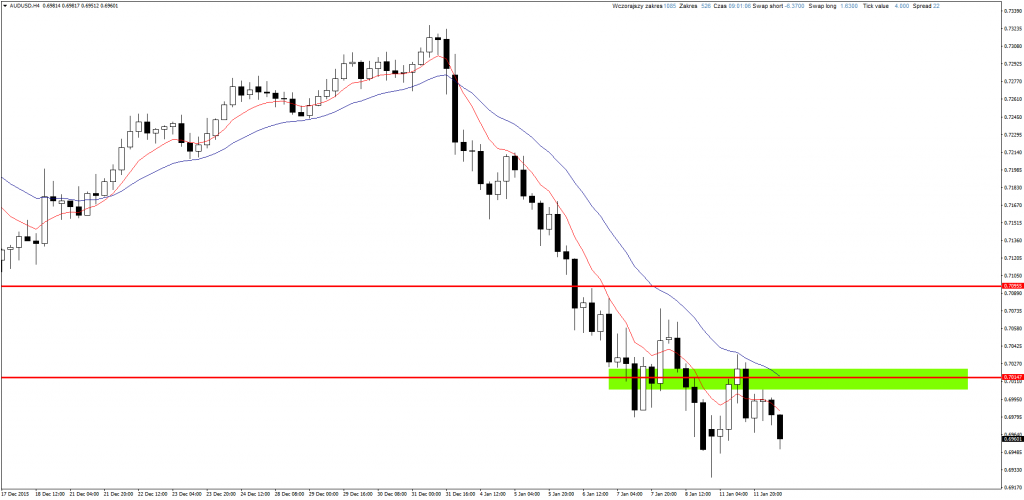
AUDUSD
On Aussie there is strong bearish sentiment and after last break of support I have waited for re-test of this level from below and open shorts after Price Action sell signal. This level was tested, but as you can see on H4 chart there was no correct sell signal. We just have to wait for another bullish correction and watch price behaviour.
If you are interested in Price Action Strategy description, you can read it here.
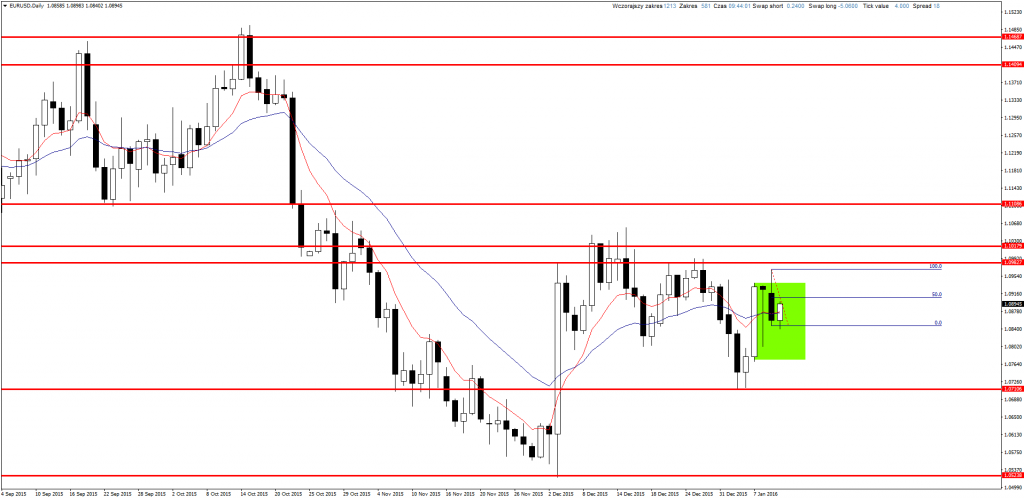
EURUSD
Yesterday we spotted Fakey setup on this pair. It is a signal near resistance so we could play it but SL was too big in comparison to TP. Currently there is bullish correction, which is getting closer to 50% retracement of signal candle and here we can find nice SL. Price is closed between resistance (tested) and support (which should be tested soon), so we can consider this position.
YOU CAN START USING PRICE ACTION AND INVEST ON FOREX MARKET USING FREE XM BROKER ACCOUNT.
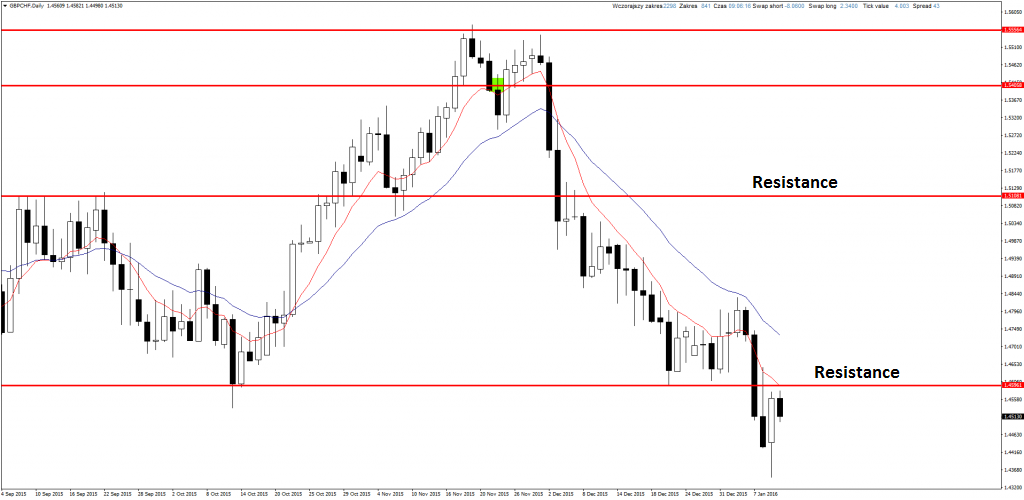
GBPCHF
Pair is in dynamic bearish trend and below key resistance (earlier support). It is worth to watch price behaviour in case of test of this level, both on H4 and D1 chart.
At night there was false break from Inside Bar setup on H4, but probably jest few observed close of the candle in the middle of the night. We have to wait for another signal.
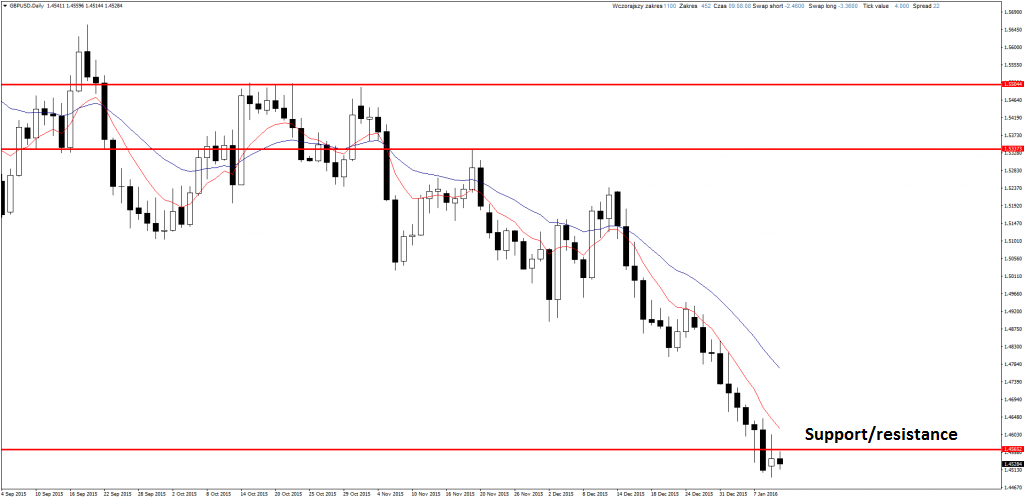
GBPUSD
Cable fell on Friday below very important support and on Monday I expected re-test from below. It really happened and resistance was rejected. There are no clear signs of sell signal both on H4 or D1 chart, so we just have to wait and look for some short opportunities.
NZDJPY
Similar situation here. There is also break of support, re-test from below and lack of sell signal for now.

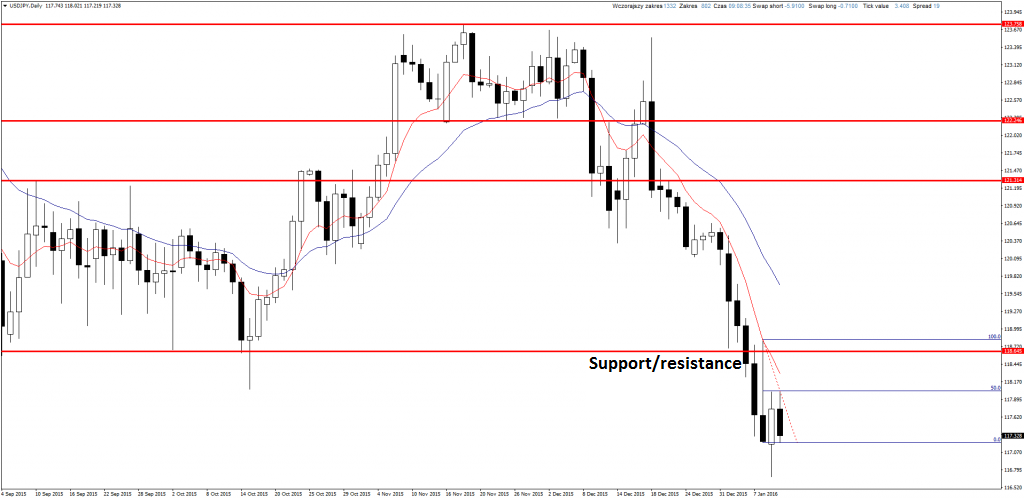
USDJPY
This pair let join the trend even for late investors because at night there was second test of 50% retracement of signal candle. Now we just have to wait for further situation and traders without position can wait for deeper bullish correction and then open shorts with better RR.


 Review")


