 Ichimoku is an investment strategy of trend following, it works great on H4, D1 and higher time frames. In this series of articles I present my setups and observations using Ichimoku, supports and resistances and Price Action patterns. You can also check previous Ichimoku overview.
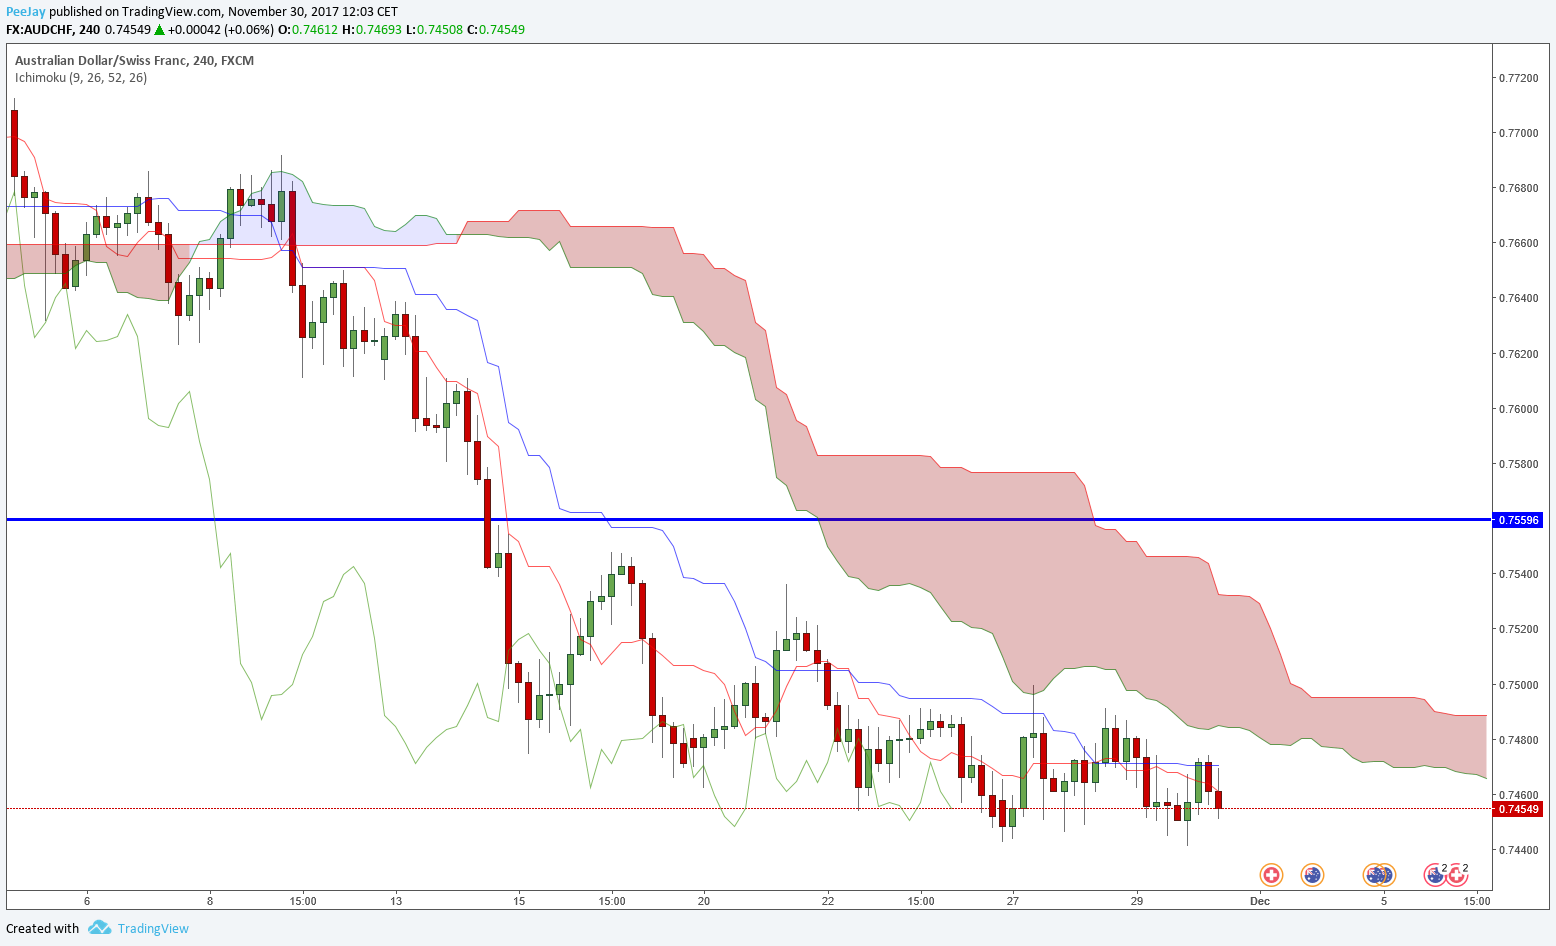
AUDCHF
On the H4 chart we can see, that price is currently in the bearish trend, what is confirmed by Kumo cloud and Tenkan/Kijun lines. Currently there was a rebound from Kijun-sen. If there will be any sell signal, we can open short position with a Stop Loss in the area of last high on 0.7500. I recommend STO broker to open this position, it is regulated by both FCA and CySEC.
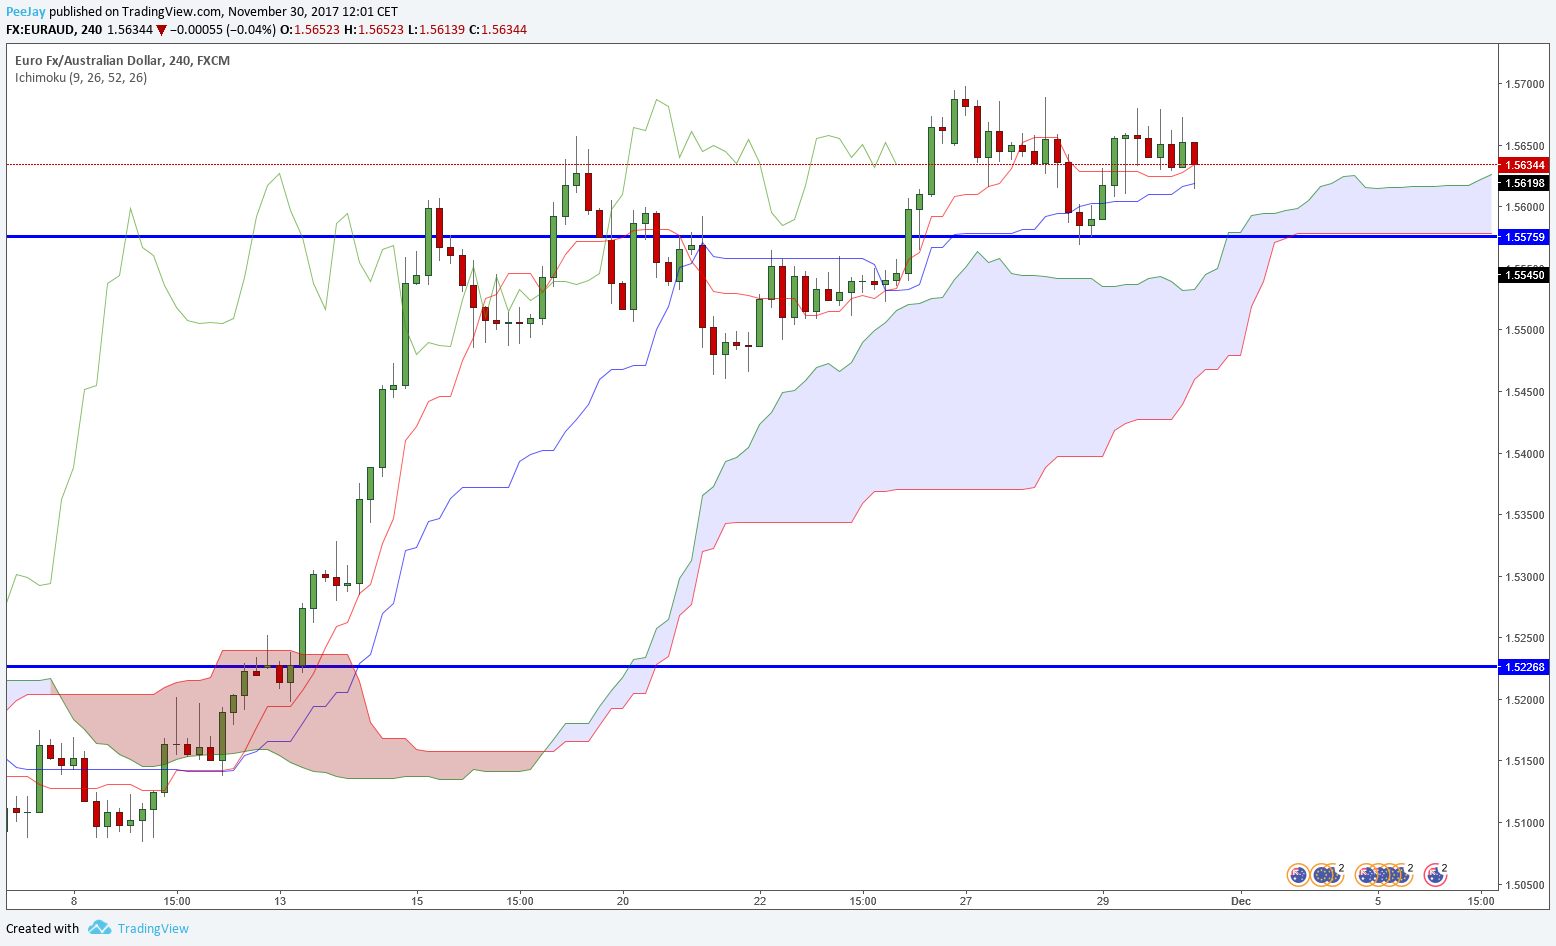
EURAUD
Price all the time respects Kijun, which is a little skewed upwards. Yesterday I opened long position, which so far brings profit of few dozen pips. It is still not to late to enter the position, we have to wait for the current candle to close, which can be a bullish pin bar.
NZDCHF
Price is trapped between daily support on 0.6725 and bearish Kumo. If the support will be broken, we can wait for its retest and open short position. However, we need to be careful for the Chikou Span line. We can go short only when the line is below price.


 Review")


