“From Investor to Scalper” is an analysis series in which we take one financial instrument each day and the analysis include a detailed look at the value from the monthly/weekly chart to the H1/M15.
AUDCHF has been moving for a long time in a bearish channel. As a result of rejection of its lower limitation, since October 2015, we have seen increases which, if compared with the history of this instrument, seem to be less dynamic.
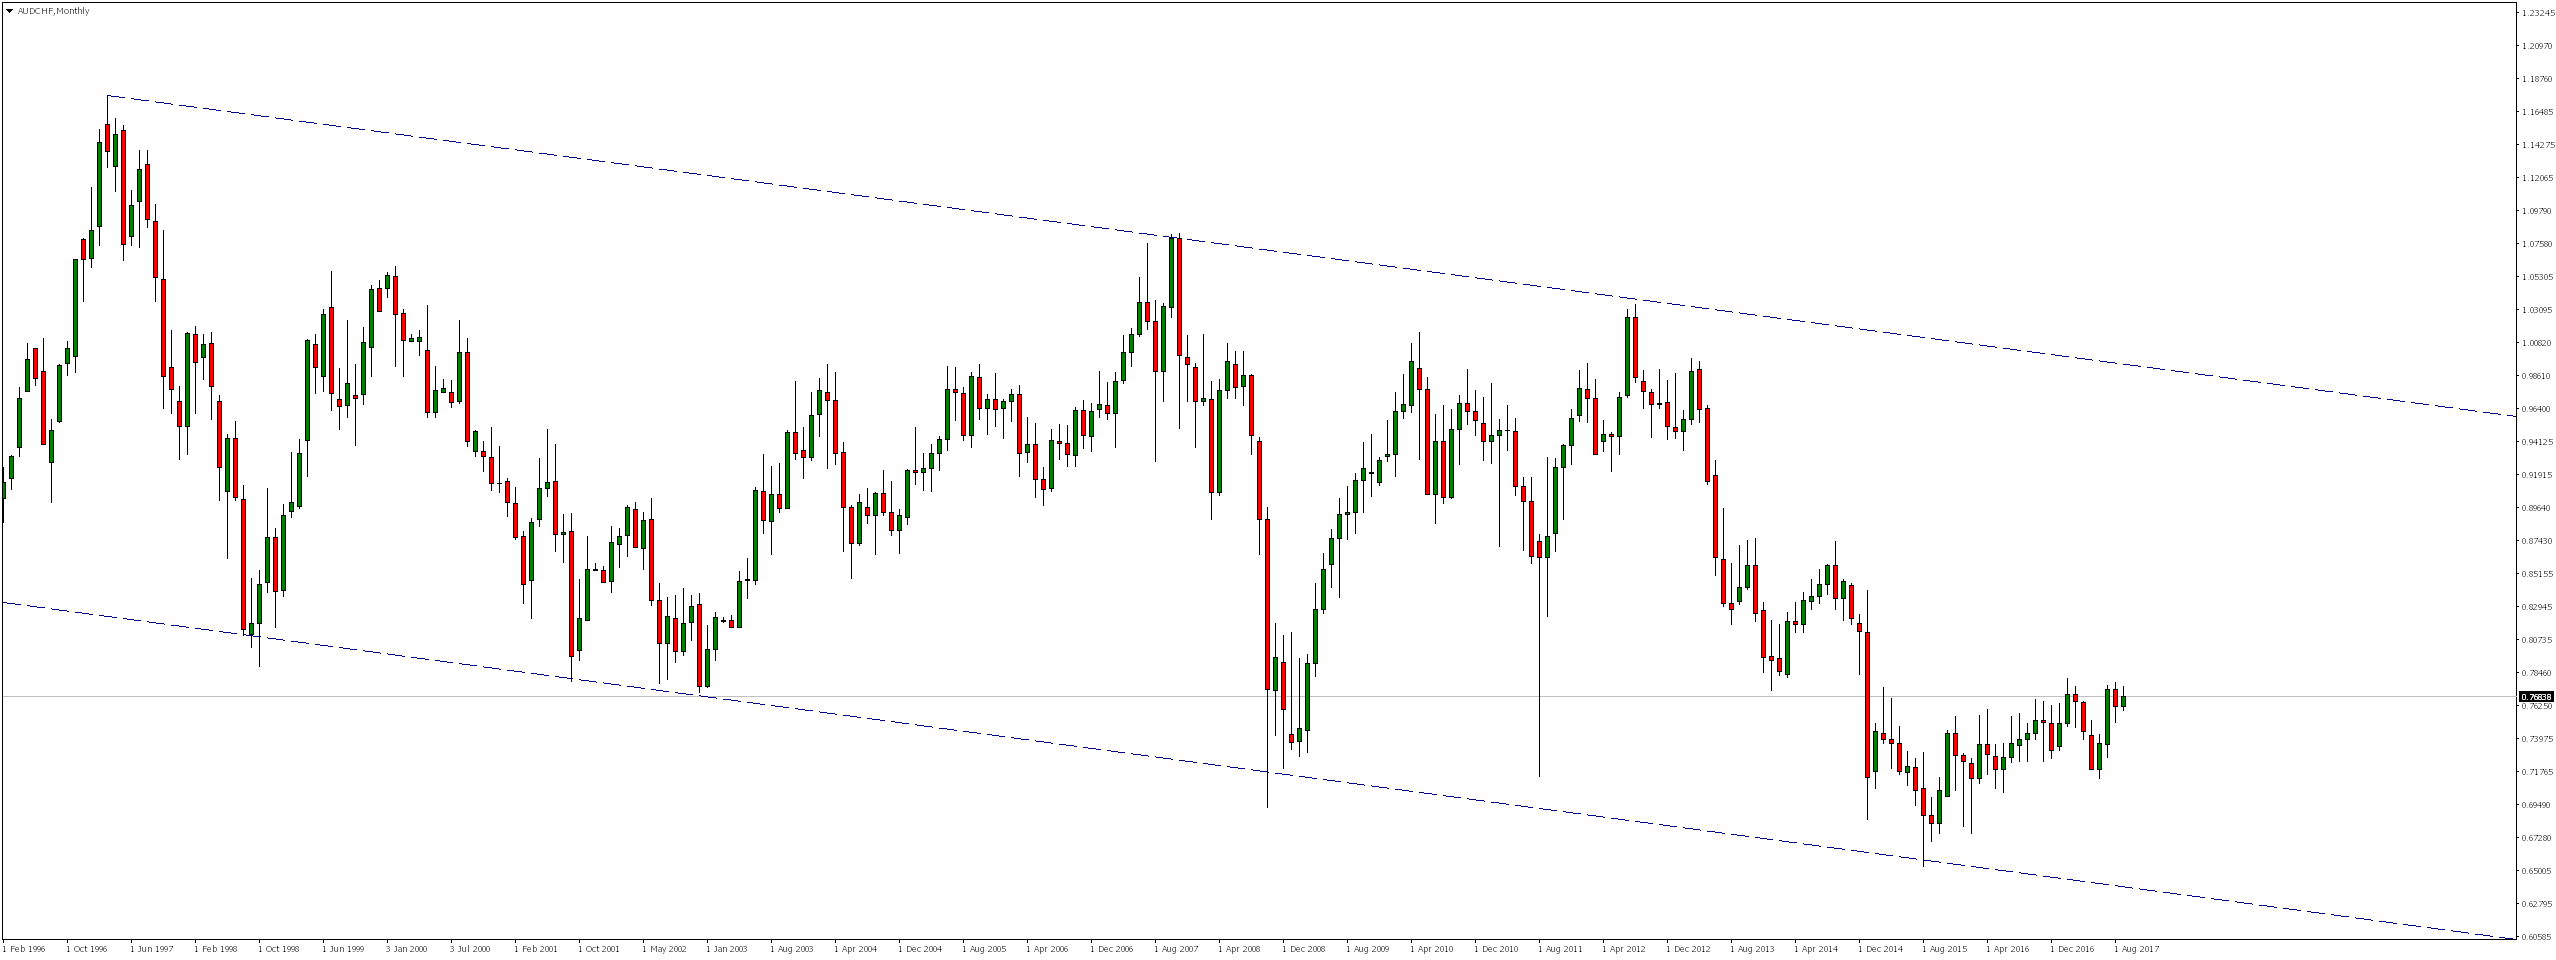
Looking at the weekly chart, we notice that the market has been trading for more than 2.5 years, and more specifically since the memorable “Black Thursday,” when there was a drastic and unexpected collapse of the market caused by the decision of the Swiss National Bank (SNB) to cut interest rates and abandon the fix EUR/CHF exchange rate at 1.20, moves in the horizontal trend.
It is worth noting that the pair has very accurately tested level of 0.7750 formed as a result of the decision of the SNB. In January 2014, this level was an important support, but after being defeated turned into resistance. It is worth noting that market is currently in the vicinity of this level and it is already its fourth re-test.
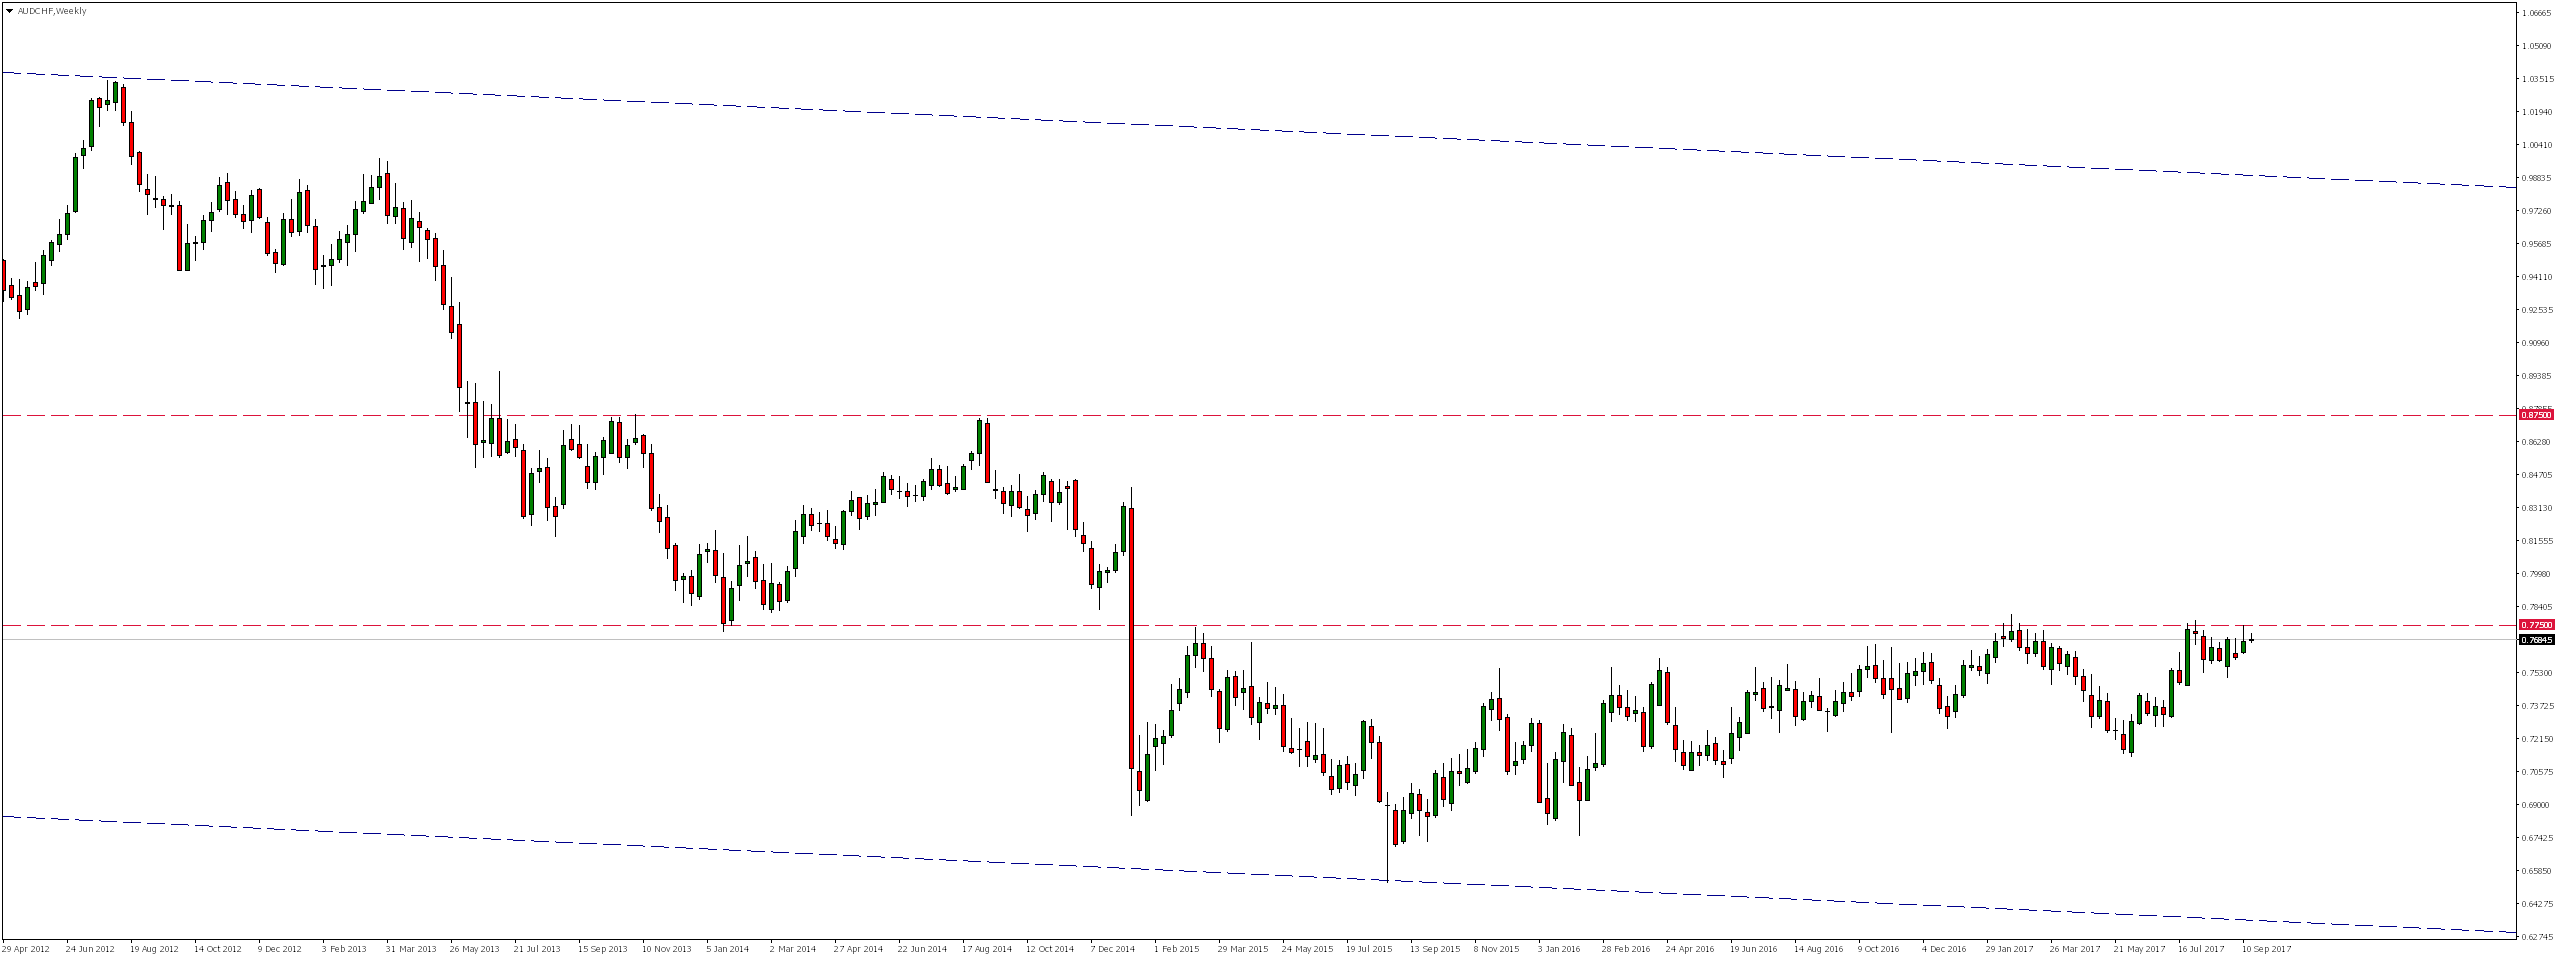
If this zone will be defeated this time, we could expect a change in market sentiment and continuation of the upward trend even to the level 0.8750 ie exactly 1000 pips away.
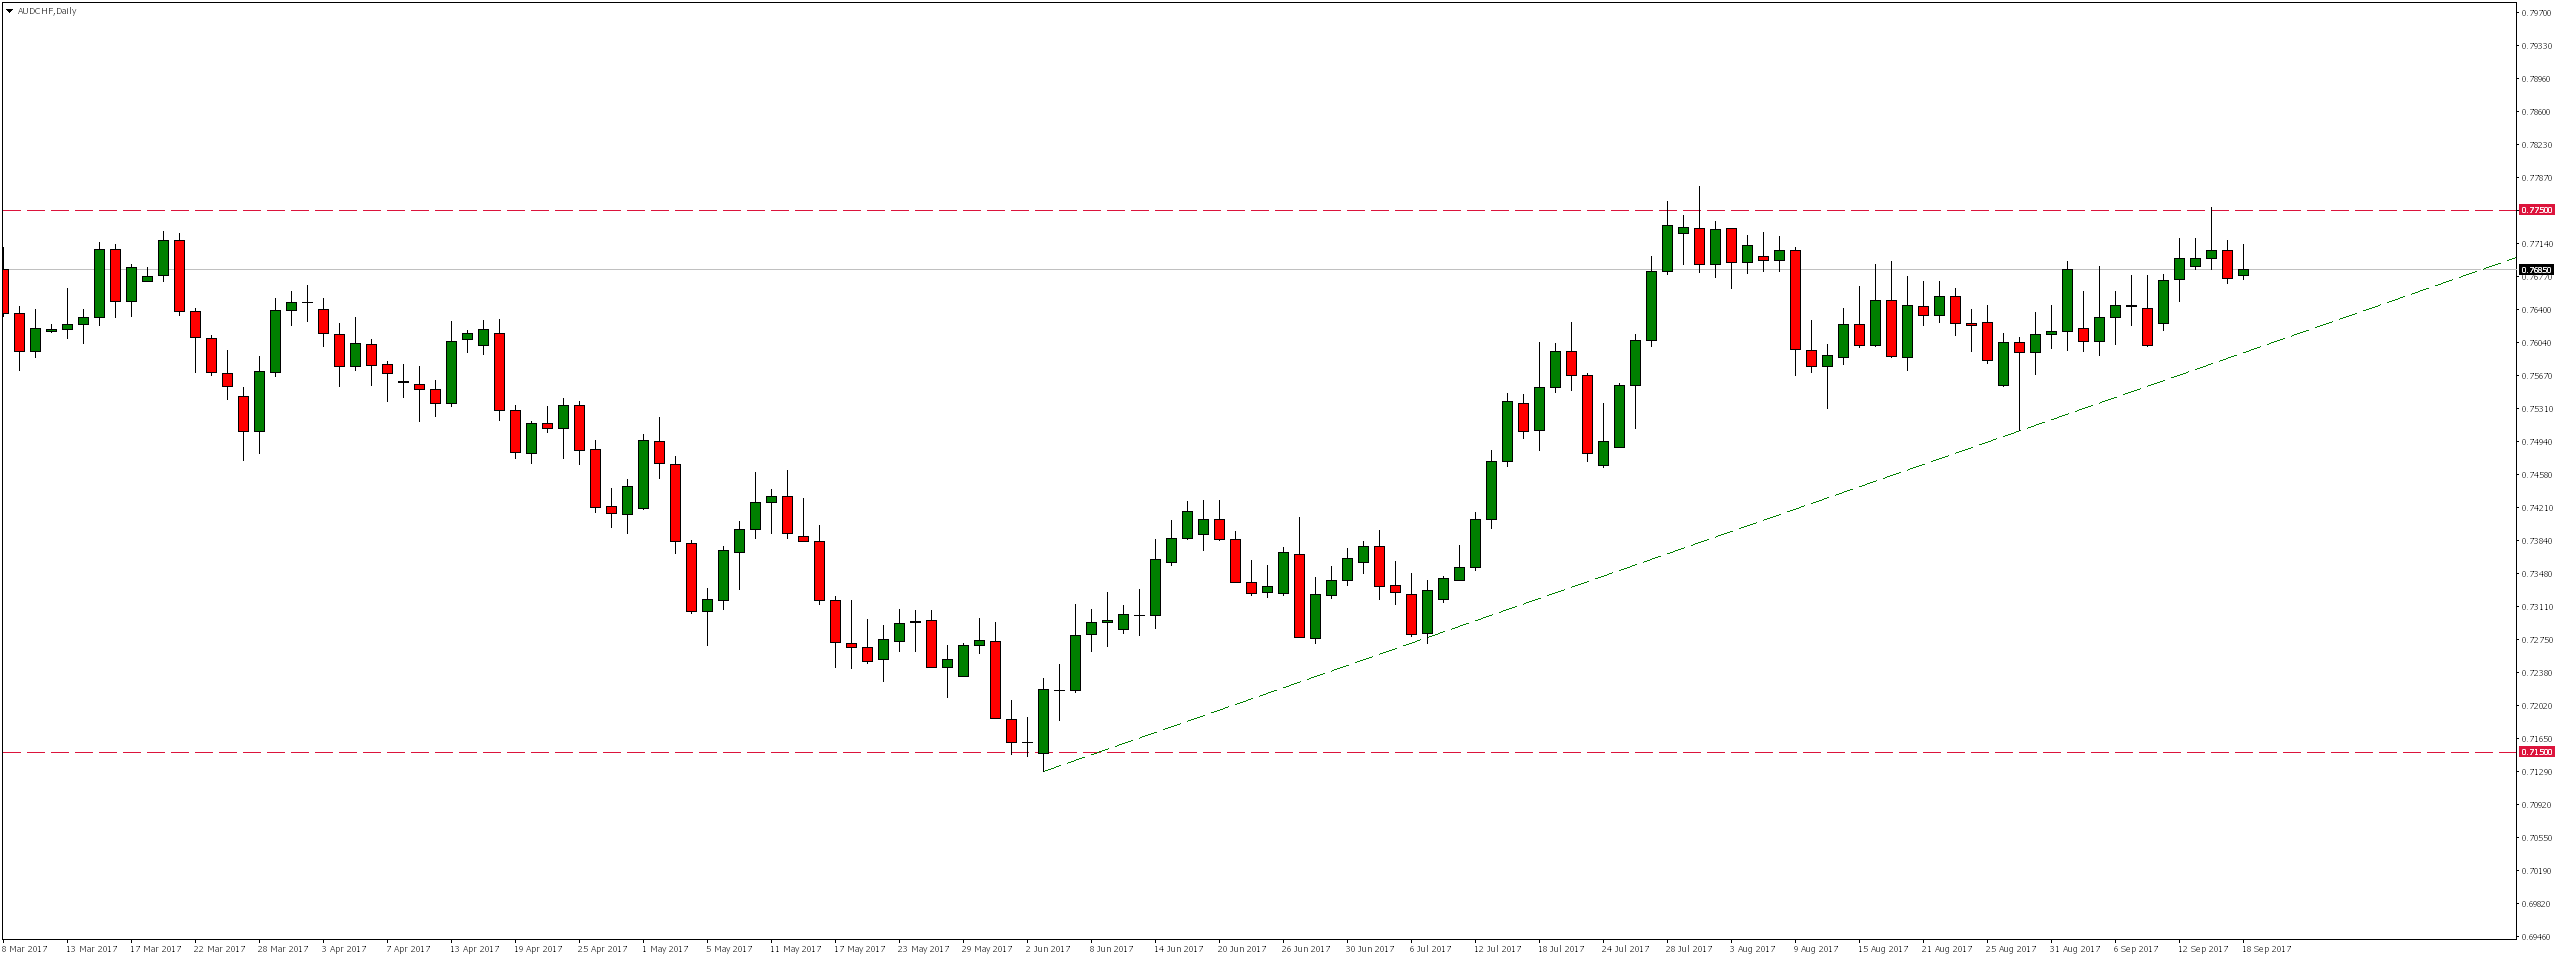
On the daily chart, however, we notice that there has been a supply reaction in the area around this level last Thursday. If this zone is rejected, then we could expect pair return to declines. However, so that we could continue in a slightly wider time horizon, we would still have to overcome the uptrend line.
Error, group does not exist! Check your syntax! (ID: 4)
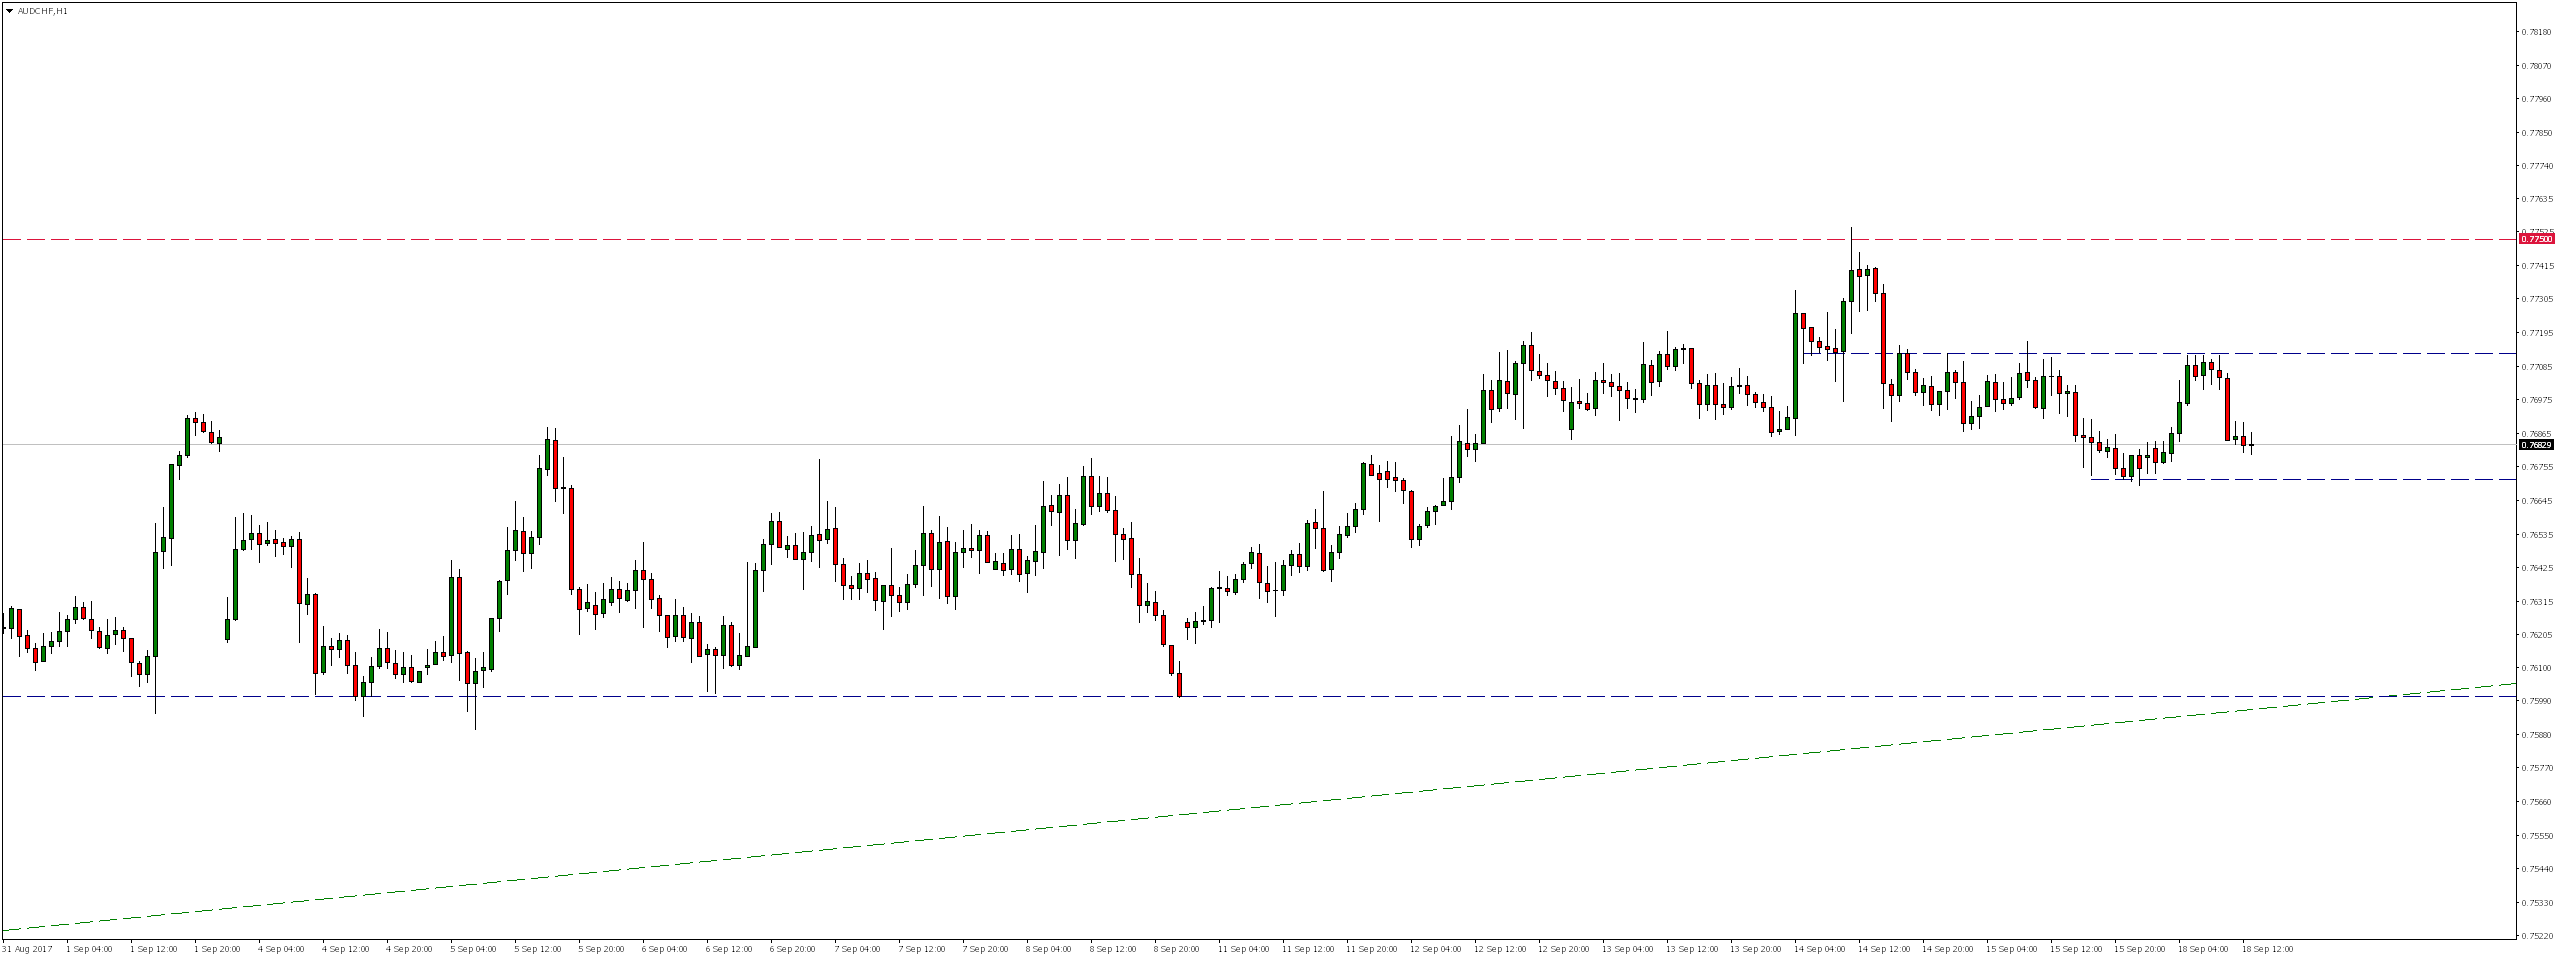
Looking on H1 chart, we will notice that the first demand response can occur sooner, already in the local support area 0.7670, which tests we would expect soon.


 Review")


