From Investor to Scalper is a cycle of analysis in which we take one financial instrument and the analysis includes a detailed look at the value from the monthly/weekly chart to the H1/M30.
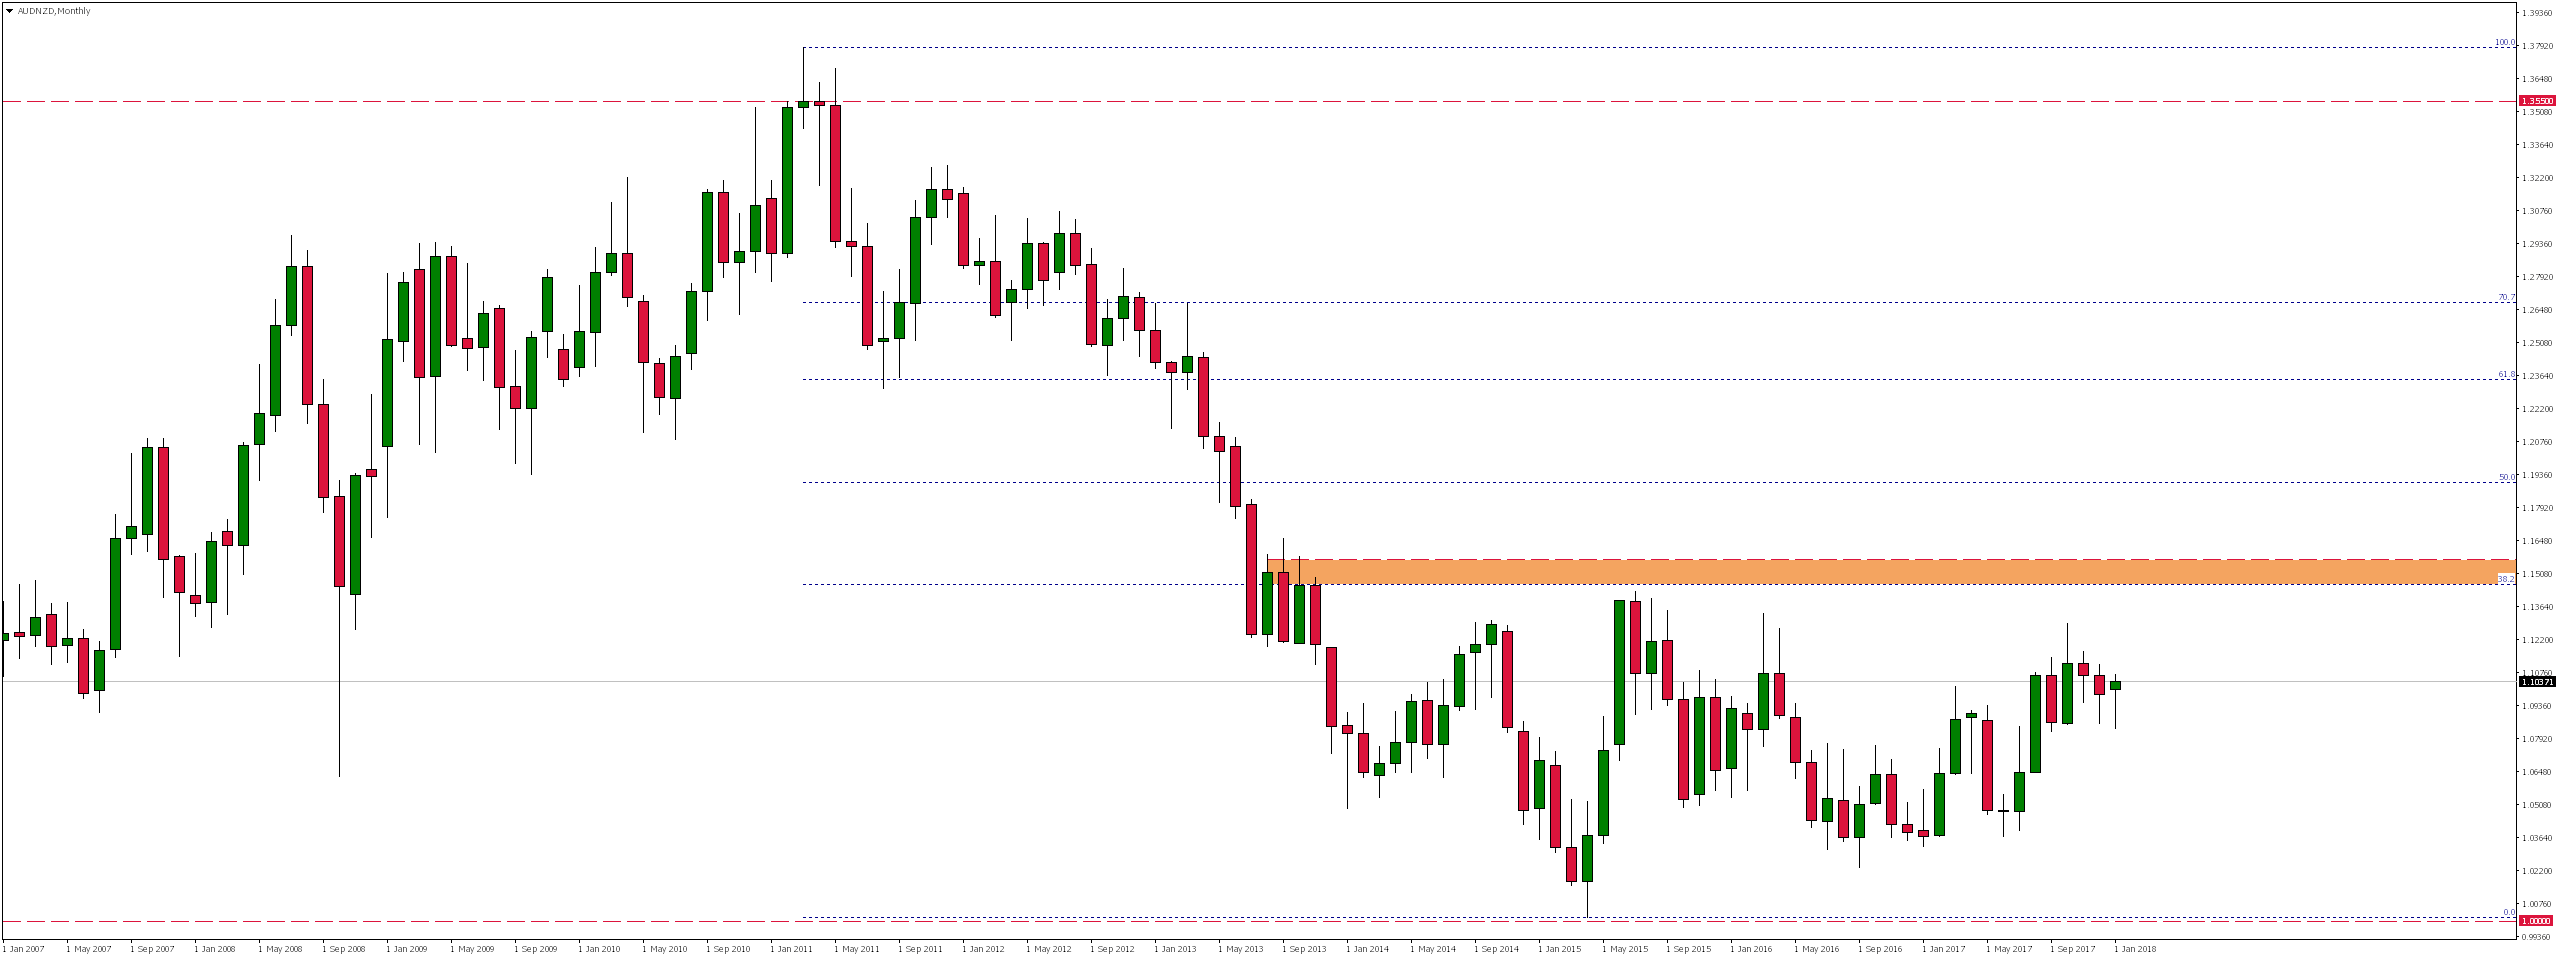
As a result of declines in April 2011, AUDNZD reached the level of 1.0000, where in April 2015. a demand reaction has appeared. Since then, we have been observing a horizontal trend (consolidation), whose upper limit coincides with the measurement of 38.2% Fibonacci adjustment.

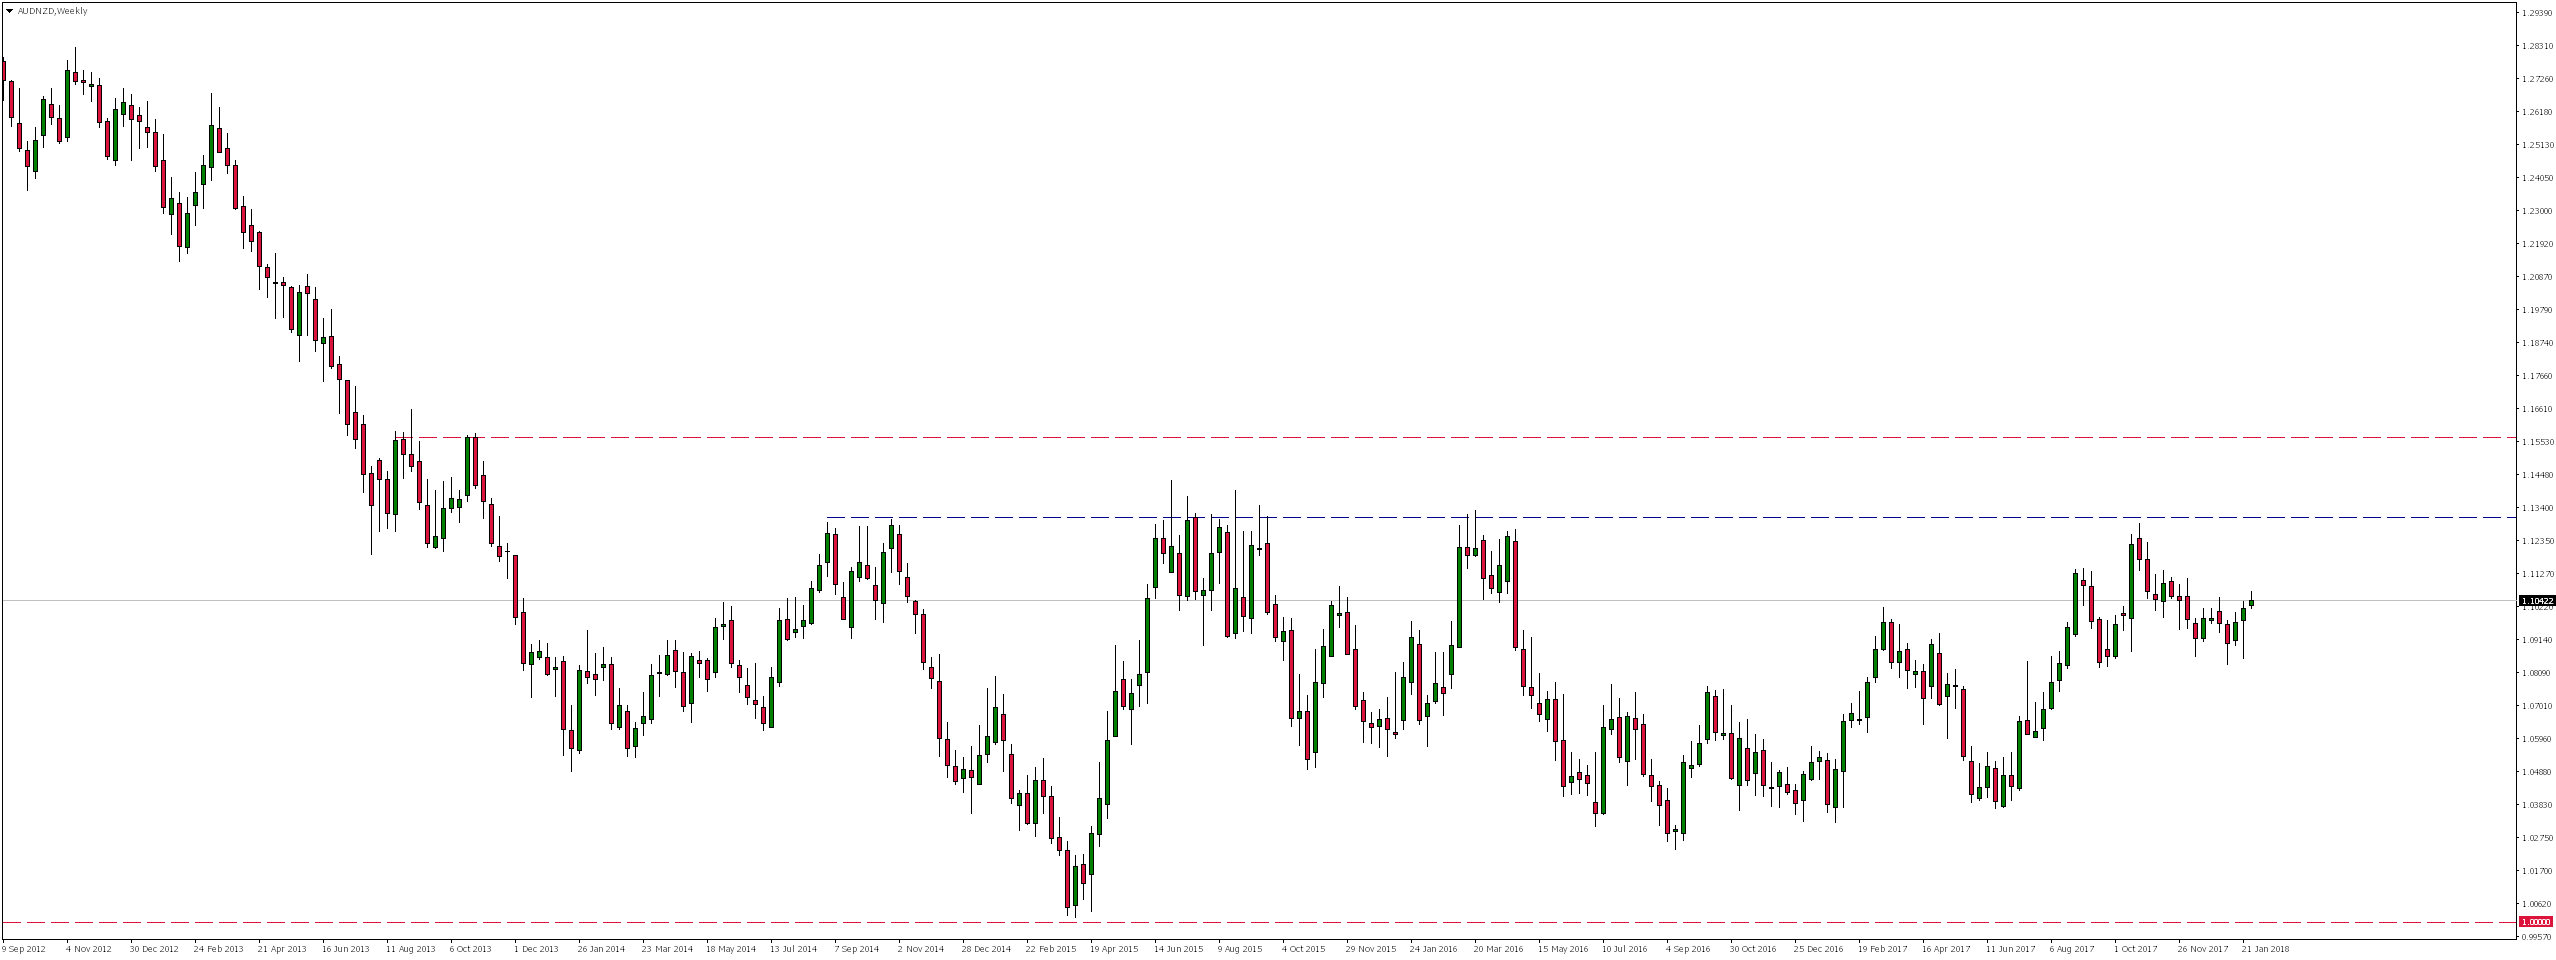
This consolidation, which has been lasting for over 4 years, is clearly visible in the weekly chart. Considering that in October we already tested the area of local resistance 1.1300, where the supply reaction appeared, in the near future we could expect continuation of going on from that time declines.
Error, group does not exist! Check your syntax! (ID: 4)
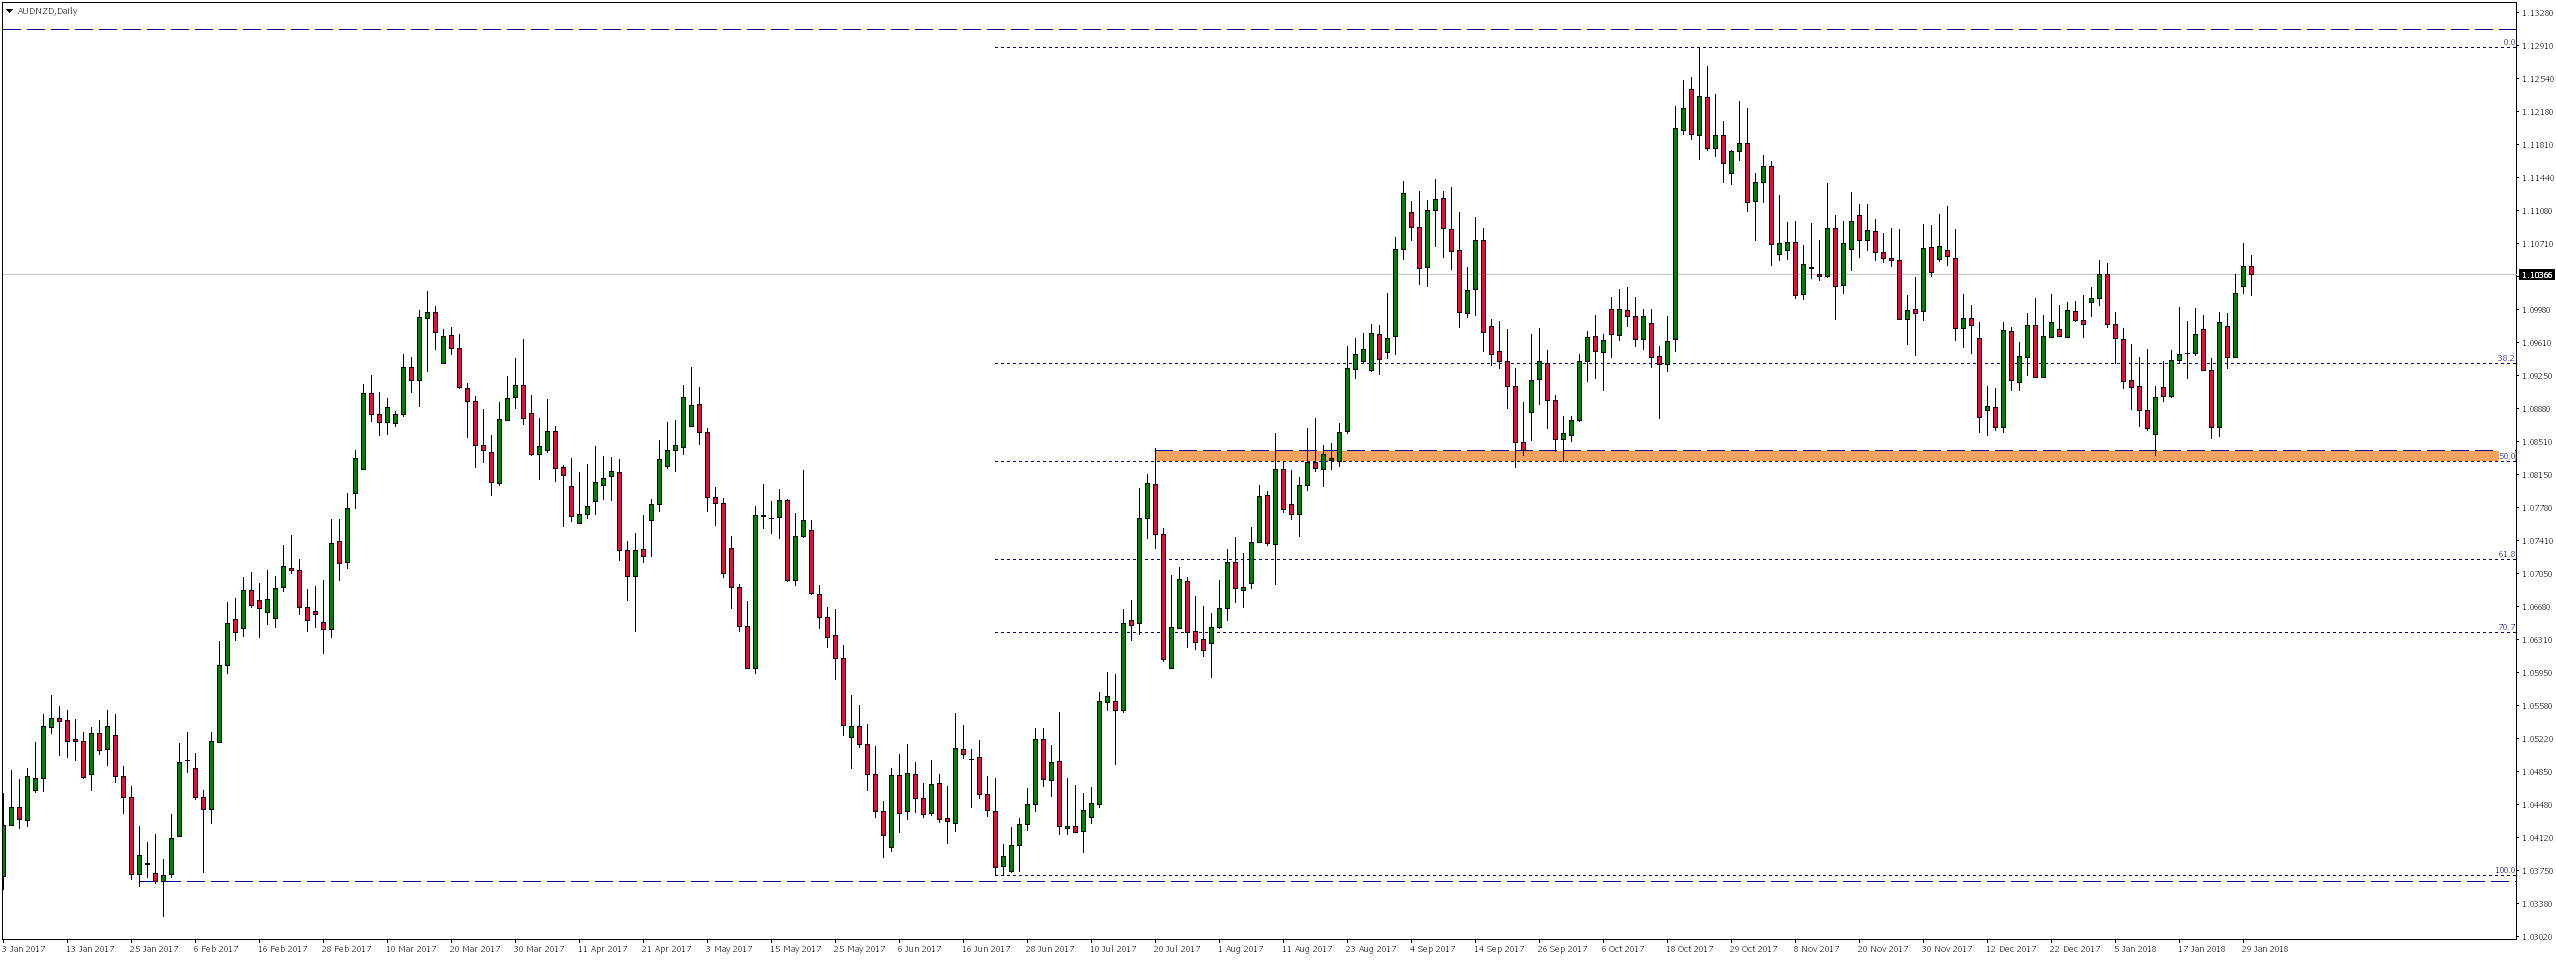
But this could happen, the price would first have to overcome local support placed at 50% Fibonacci correction from the last growth impulse. There, however, a demand reaction appeared several times, which may indicate strength of this zone.

The potential growth in the near future may be supported by the fact that last Friday the market overcame local resistance (now support). Re-testing and rejection of this zone from the top could be an interesting opportunity to join the growth.

 STO is a broker regulated by FCA and CySEC. It offers more than 300 financial instruments such as Forex, Indices, Oil, Stocks, Commodities and Bonds. STO clients have possibility to trade thanks to reliable MT4 and AFX FAST platforms. Check STO offer!


