![]()
![]() From Investor to Scalper – series of studies created in cooperation with broker BDSwiss, in which we take a financial instrument and the analysis includes a detailed look at the value from the monthly chart and ending with 5/15 minutes.
From Investor to Scalper – series of studies created in cooperation with broker BDSwiss, in which we take a financial instrument and the analysis includes a detailed look at the value from the monthly chart and ending with 5/15 minutes.
Since 2008 EURUSD is moving down. As a result of defeating in January 2015 support zone around levels of 1.18 – 1.19 for nearly two years we observed consolidation of the market which actually broke through the bottom.
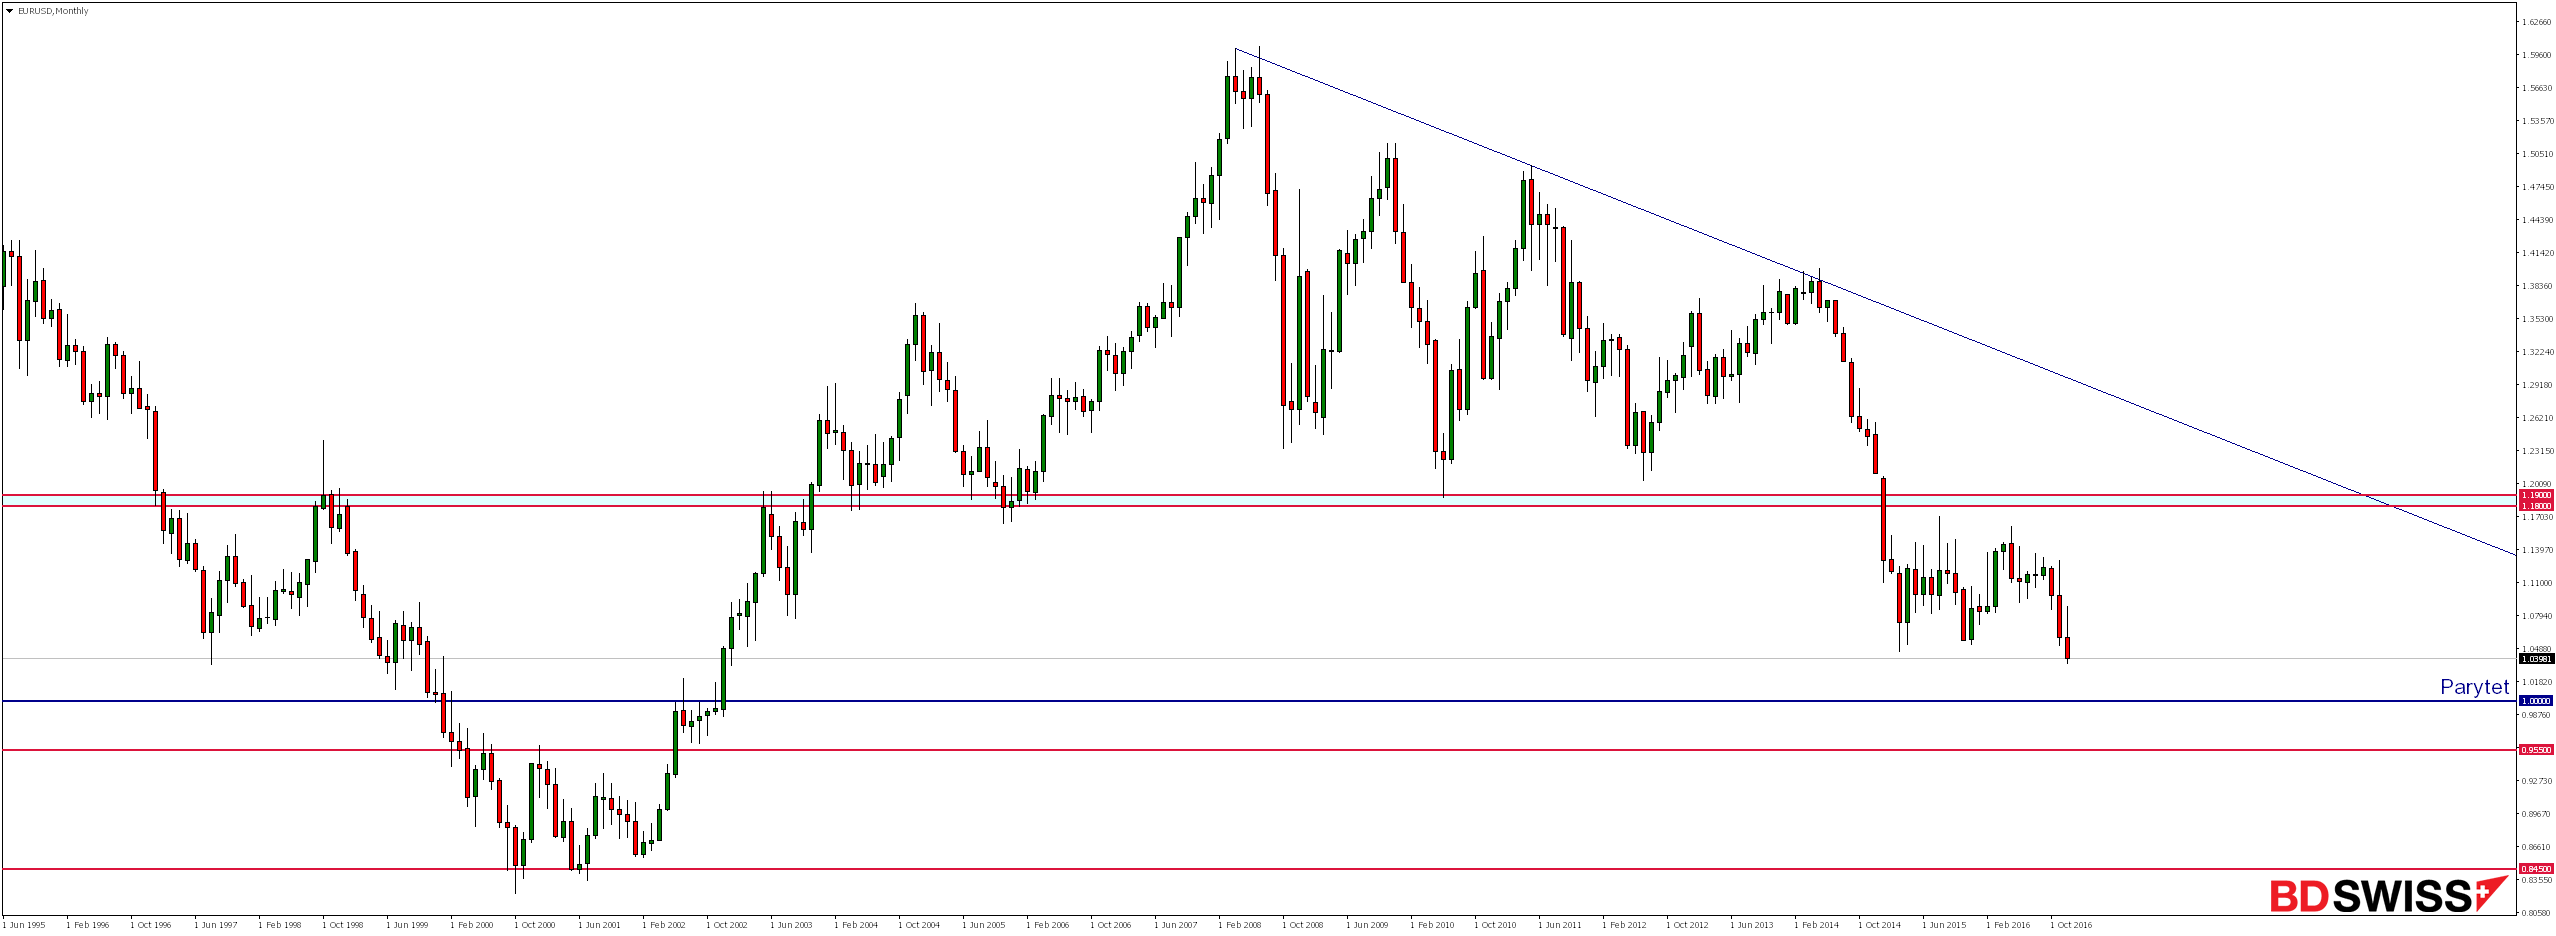
Looking at the weekly chart we see that due to the decision of the FOMC to raise interest rates from 0.50% to 0.75% last week market overcame level of 1.0490 which is the lower band of two years consolidation.
If declines will continue the more likely seems achieving parity at 1.00.

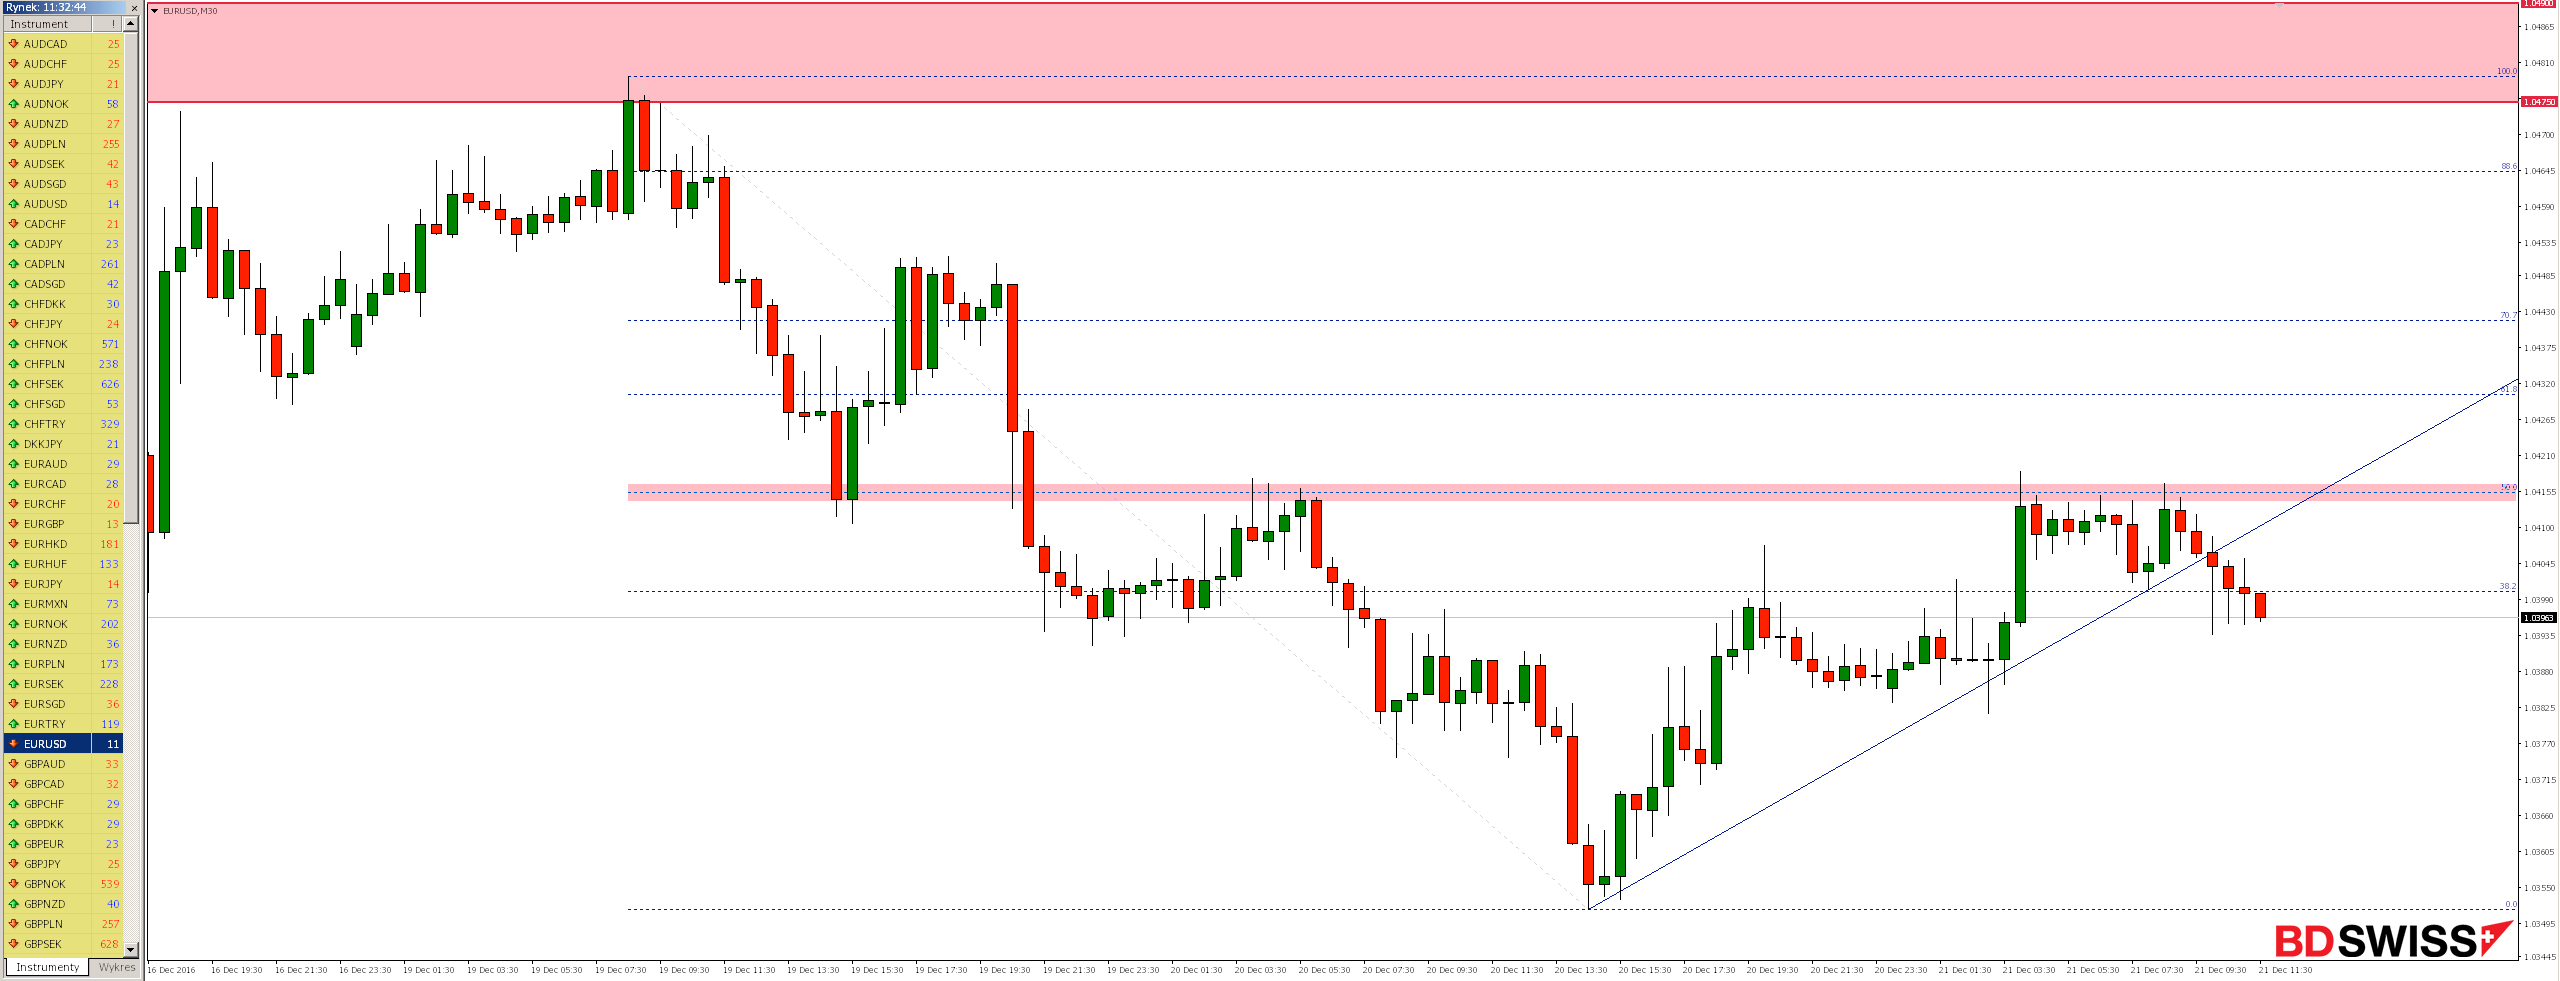
Since yesterday’s noon we see bullish correction but already in the area of local resistance 1.0410 there was bearish response. Rejection of this level would be a signal to continue declines.

Looking at M30 we can notice that mentioned resistance around which appeared bearish response coincides with the level of momentum 50% Fibonacci correction of the last downward impulse. Continuation of declines in the near future could be supported by fact that the market today defeated line of upward trend ongoing from yesterday.
Use analysis to invest with Broker BDSwiss, with whom at the time of the creation of the analysis the spread on the CADCHF pair was 1.1 pips.


 Review")


