![]()
![]() From Investor to Scalper – series of studies created in cooperation with broker BDSwiss, in which we take a financial instrument and the analysis includes a detailed look at the value from the monthly chart and ending with 5/15 minutes.
From Investor to Scalper – series of studies created in cooperation with broker BDSwiss, in which we take a financial instrument and the analysis includes a detailed look at the value from the monthly chart and ending with 5/15 minutes.
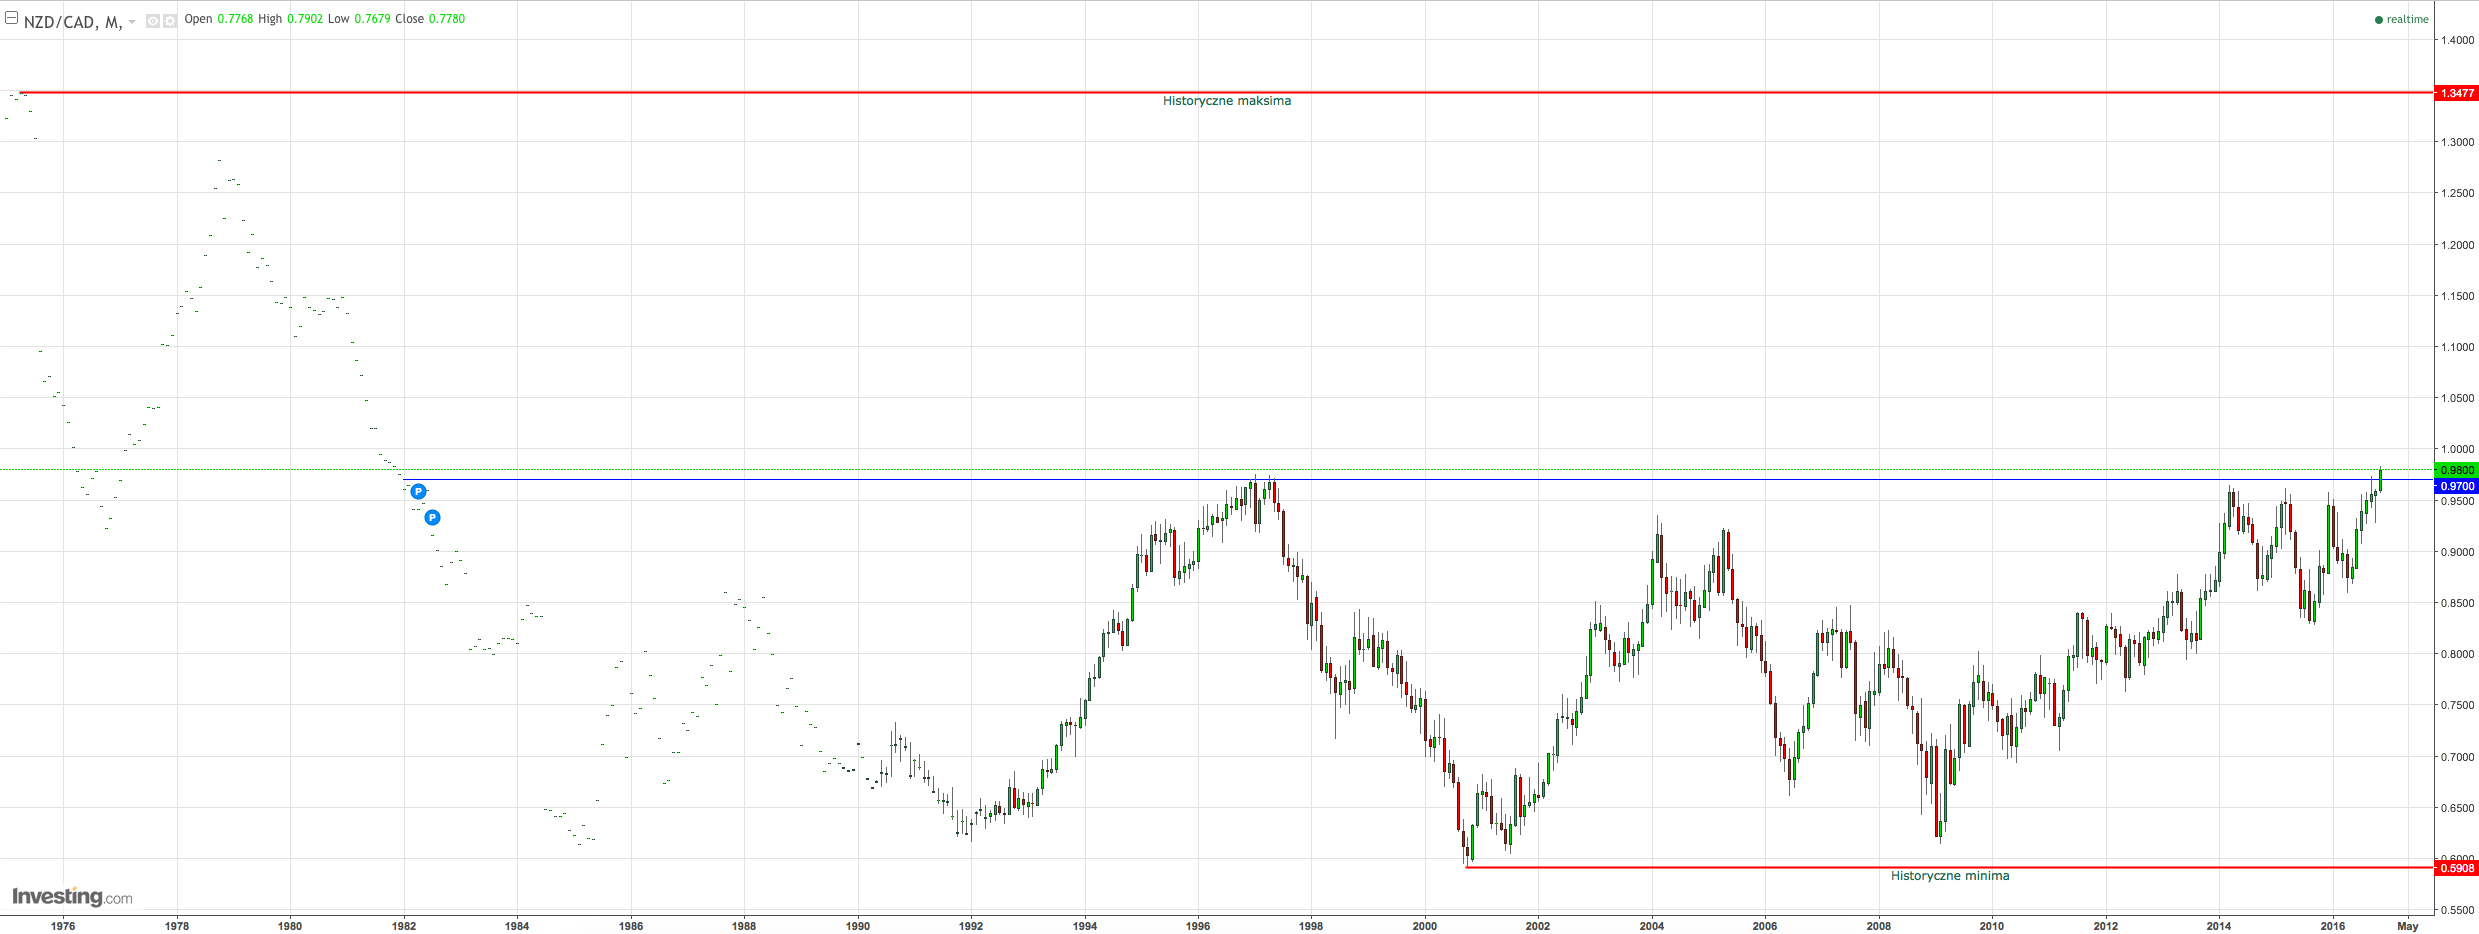
Currency pair NZDCAD for several years is moving north and in the result of that now we break a very important resistance 0.9700, which coincides exactly with the level of momentum 50% Fibonacci between the historical maximum and minimum. Durable overcome this level could open the way for further growth in the longer term.
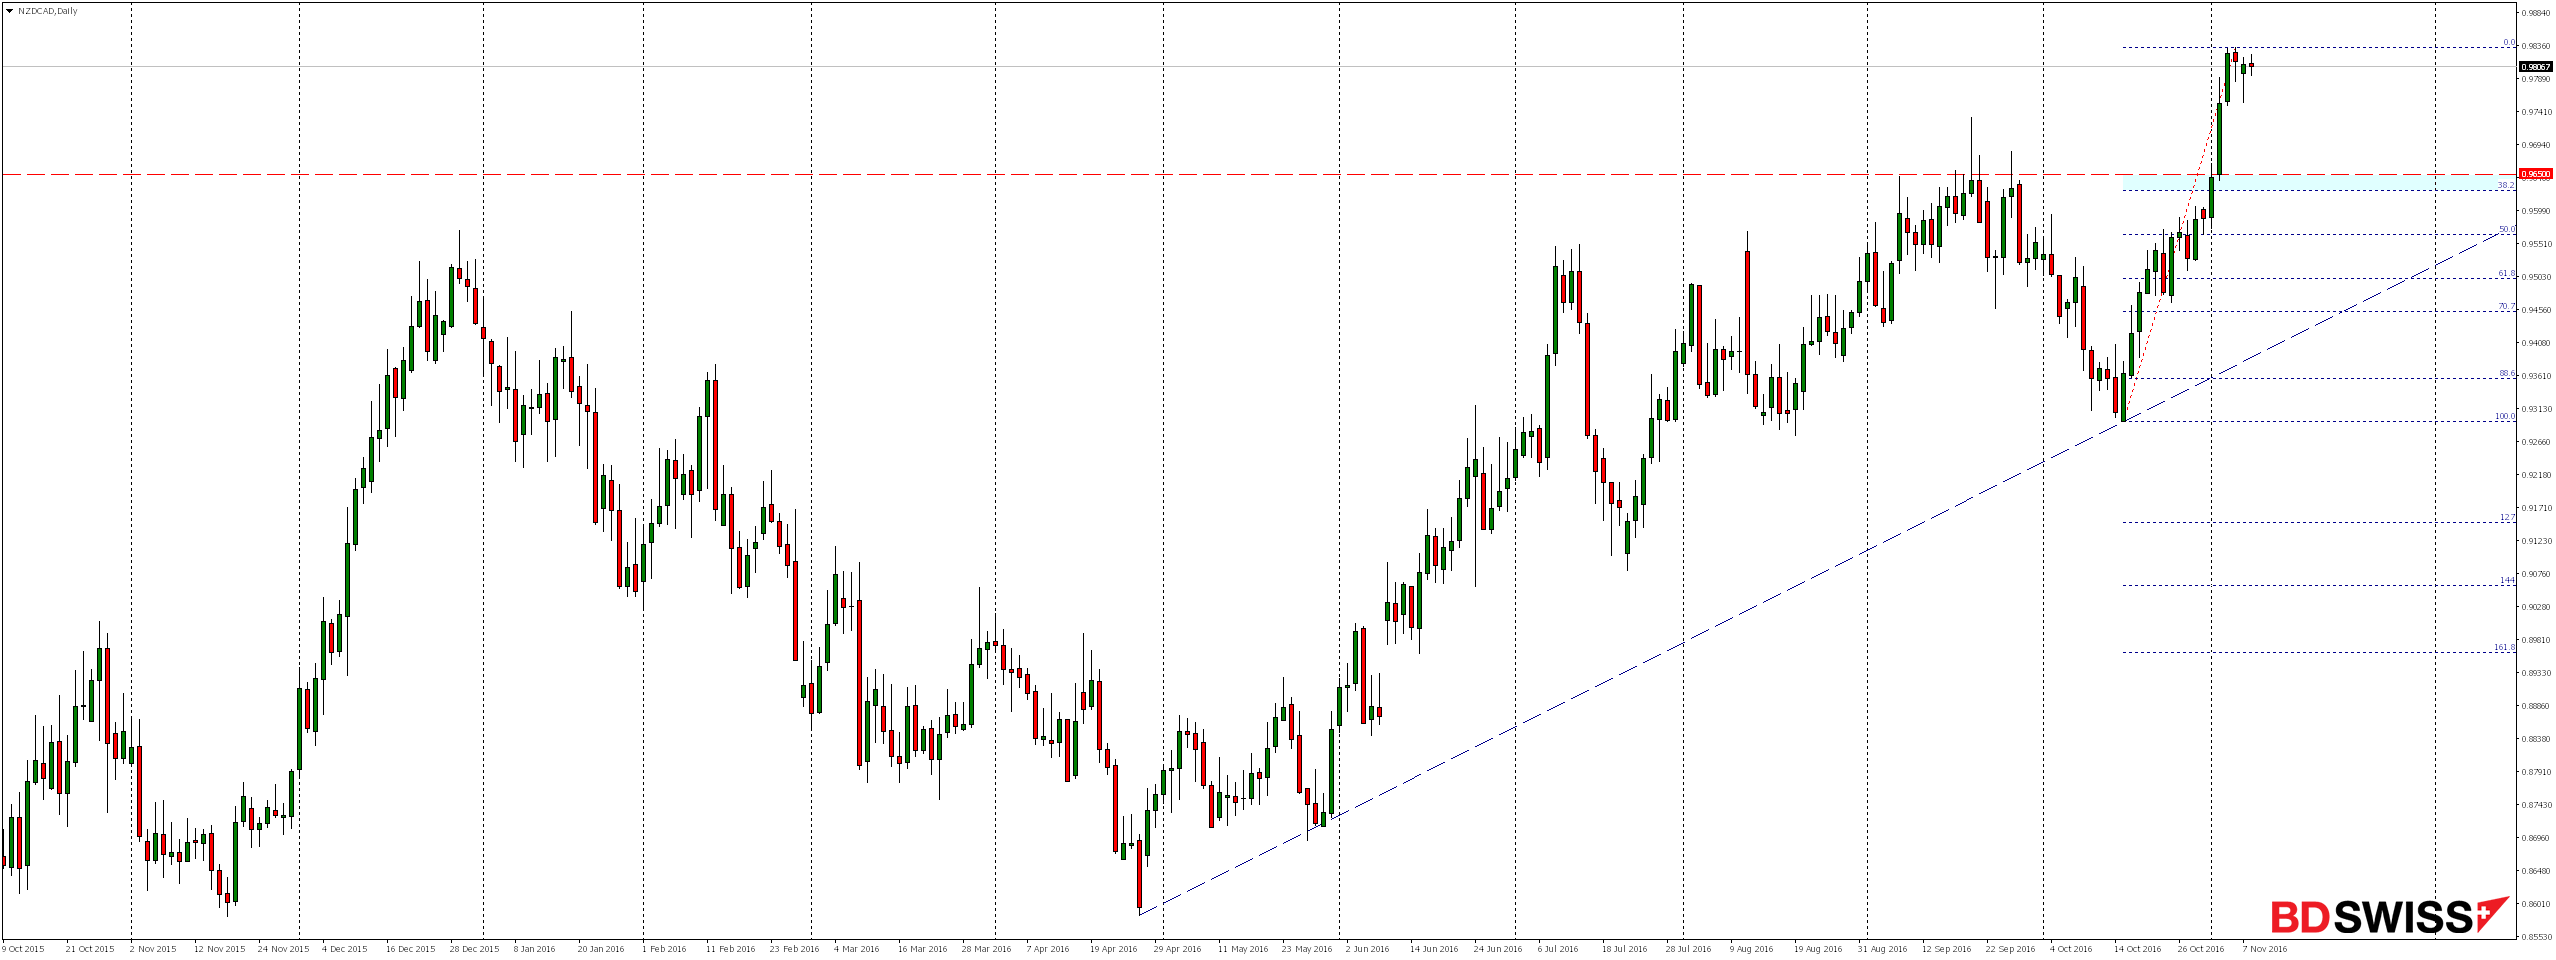
On the daily chart we observe dynamic growth. In accordance with the principle of changing the poles in the near future we can expect a gentle downward correction and re-testing defeated at the beginning of the month resistance (now support) 0.9650 and located around the level of 38.2% Fibonacci correction of the last growth impulse.
Looking at the chart H4 we can see that the potential downward correction could be stoped by the upward trend line or local support 0.9716 or further coinciding with the level of 61.8% Fibonacci correction of last week’s growth impulse.

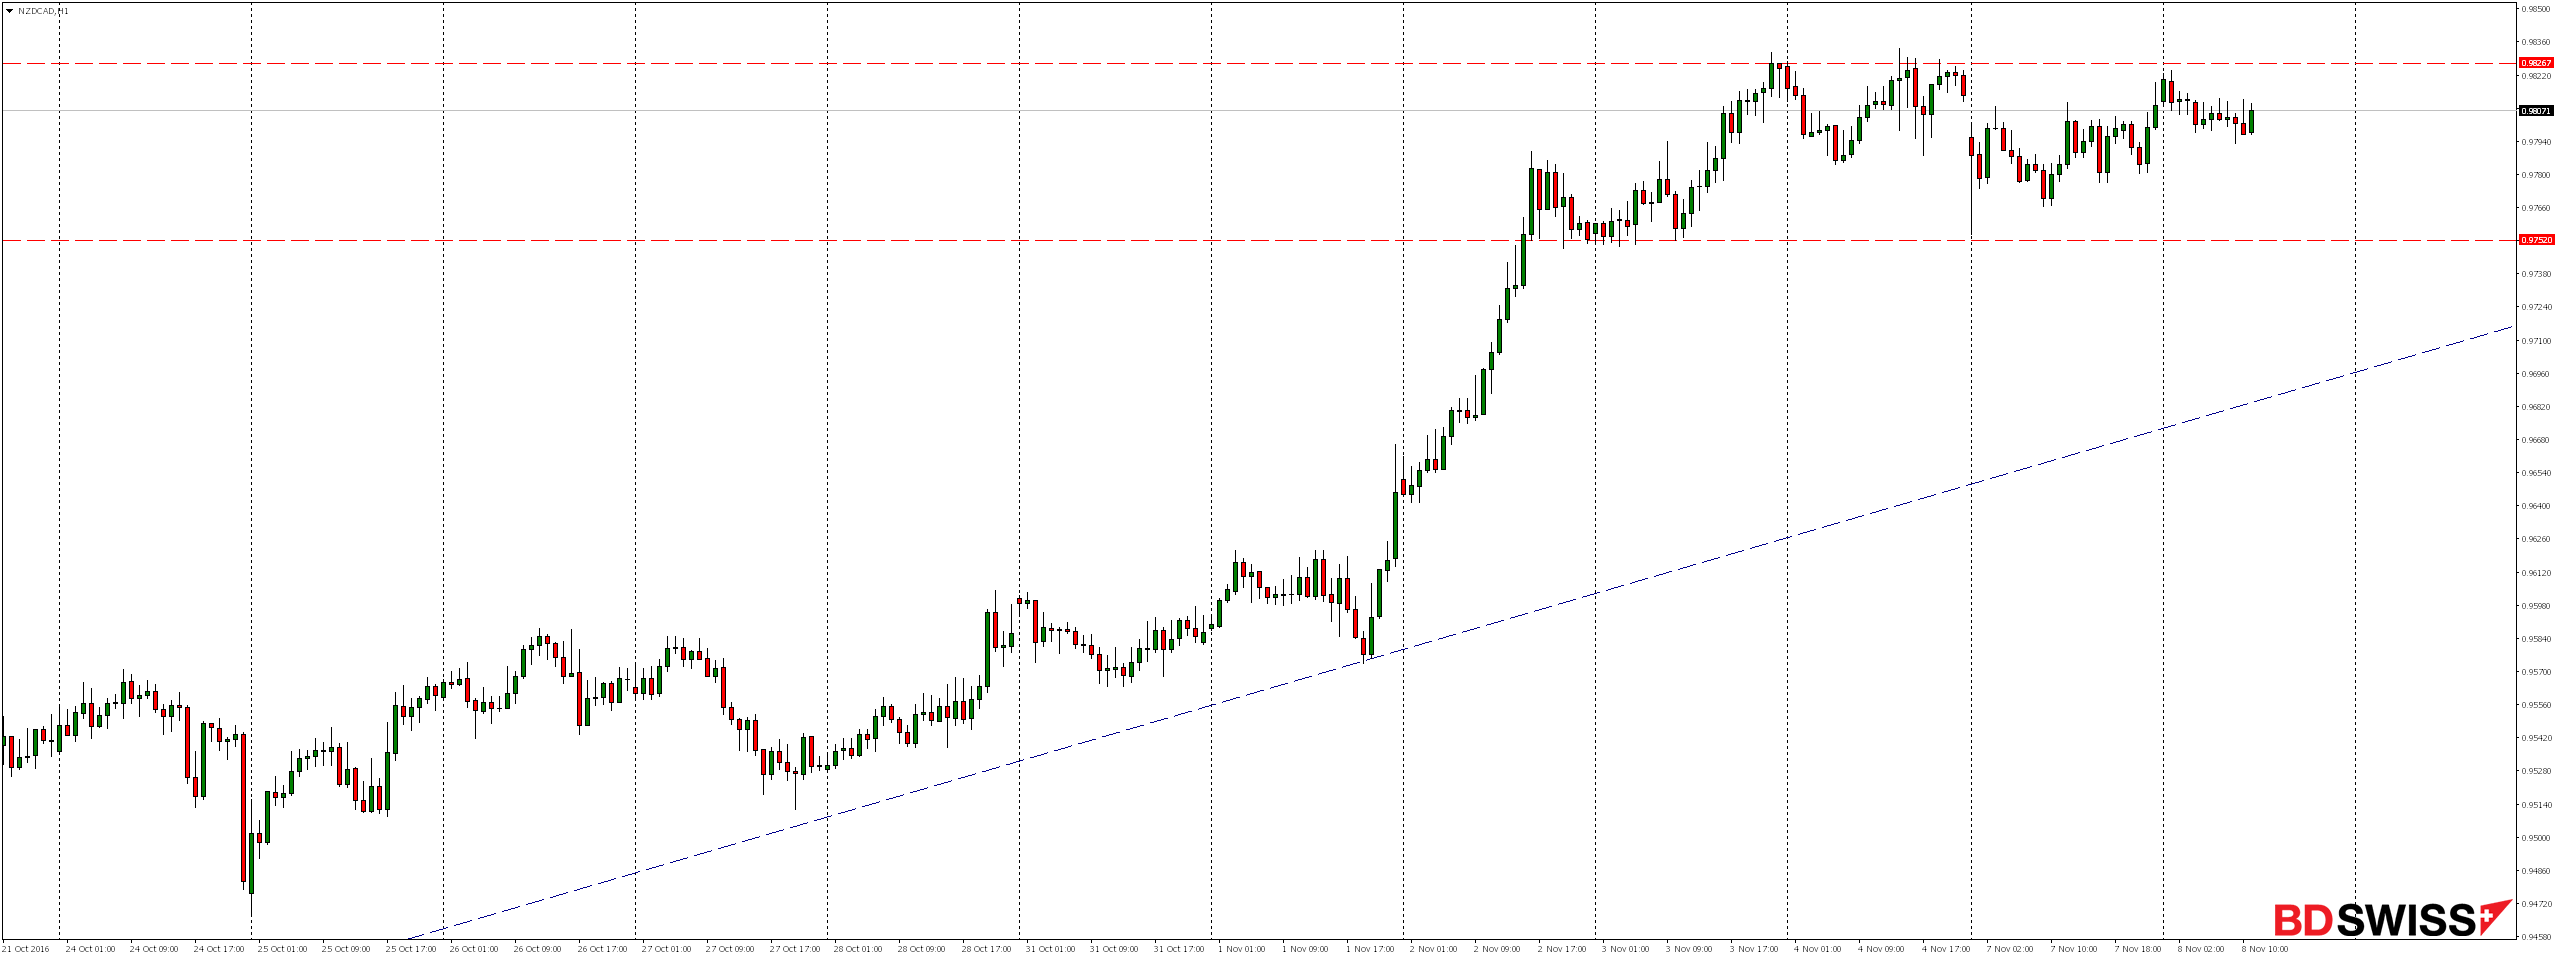
At the H1 chart for nearly five days we see consolidation within one box and as long as the market does not support breakout through the bottom 0.9752 I’d be wary of opening short positions as we have still a strong upward trend.
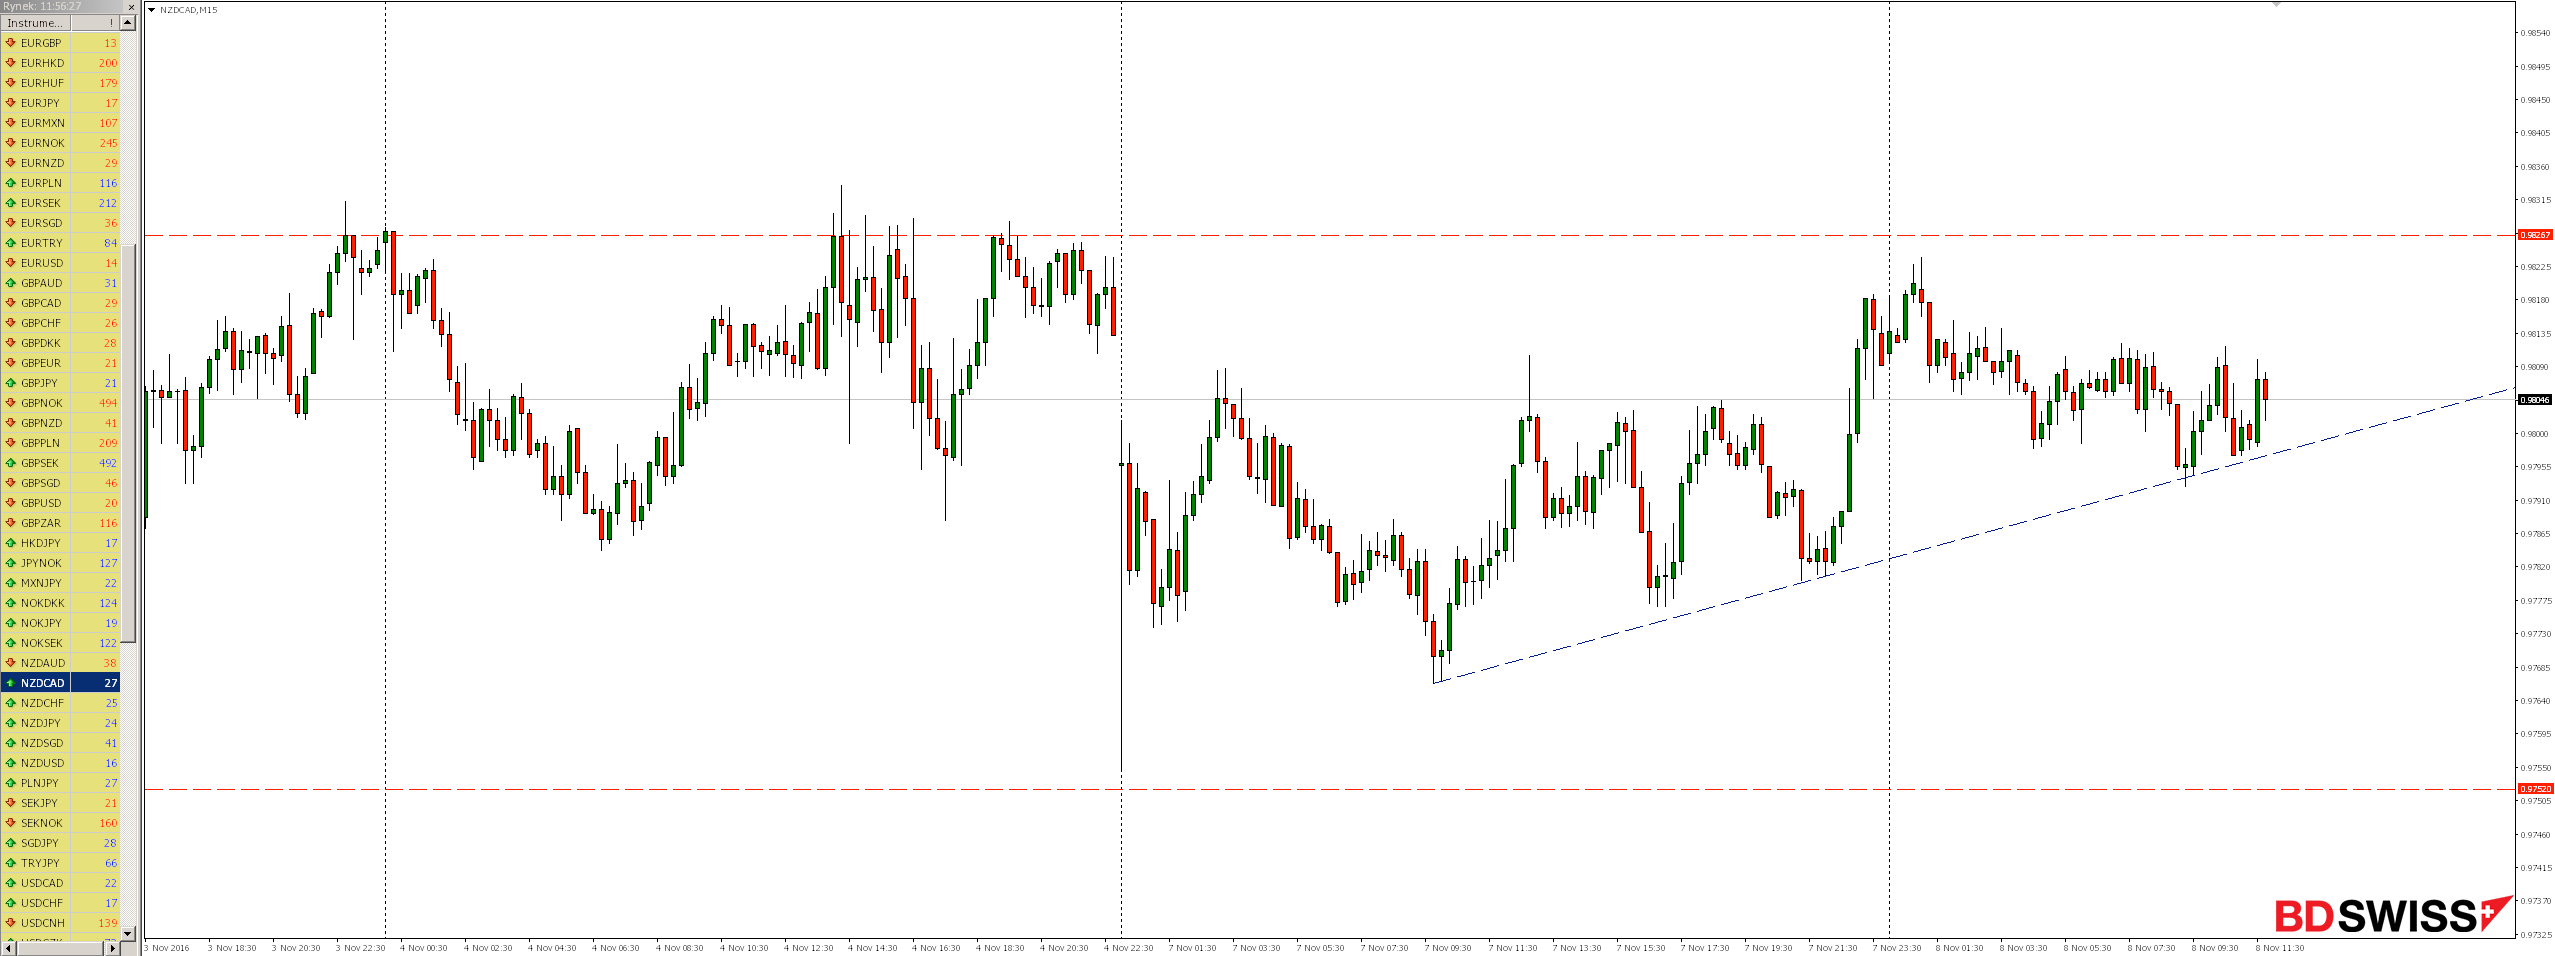
Looking at the chart M15 we see that the market is currently oscillates around the line of the local uptrend and if in the near future, this level will not be defeated, then we could expect the next re-test 0.9827 resistance
To make an offer to invest Broker BDSwiss and use a low spread, which at the time of the creation of analysis NZDCAD amounted to 2.7 pips.


 Review")


