From Investor to Scalper is a cycle of analysis in which we take one financial instrument and the analysis includes a detailed look at the value from the monthly/weekly chart to the H1/M15.
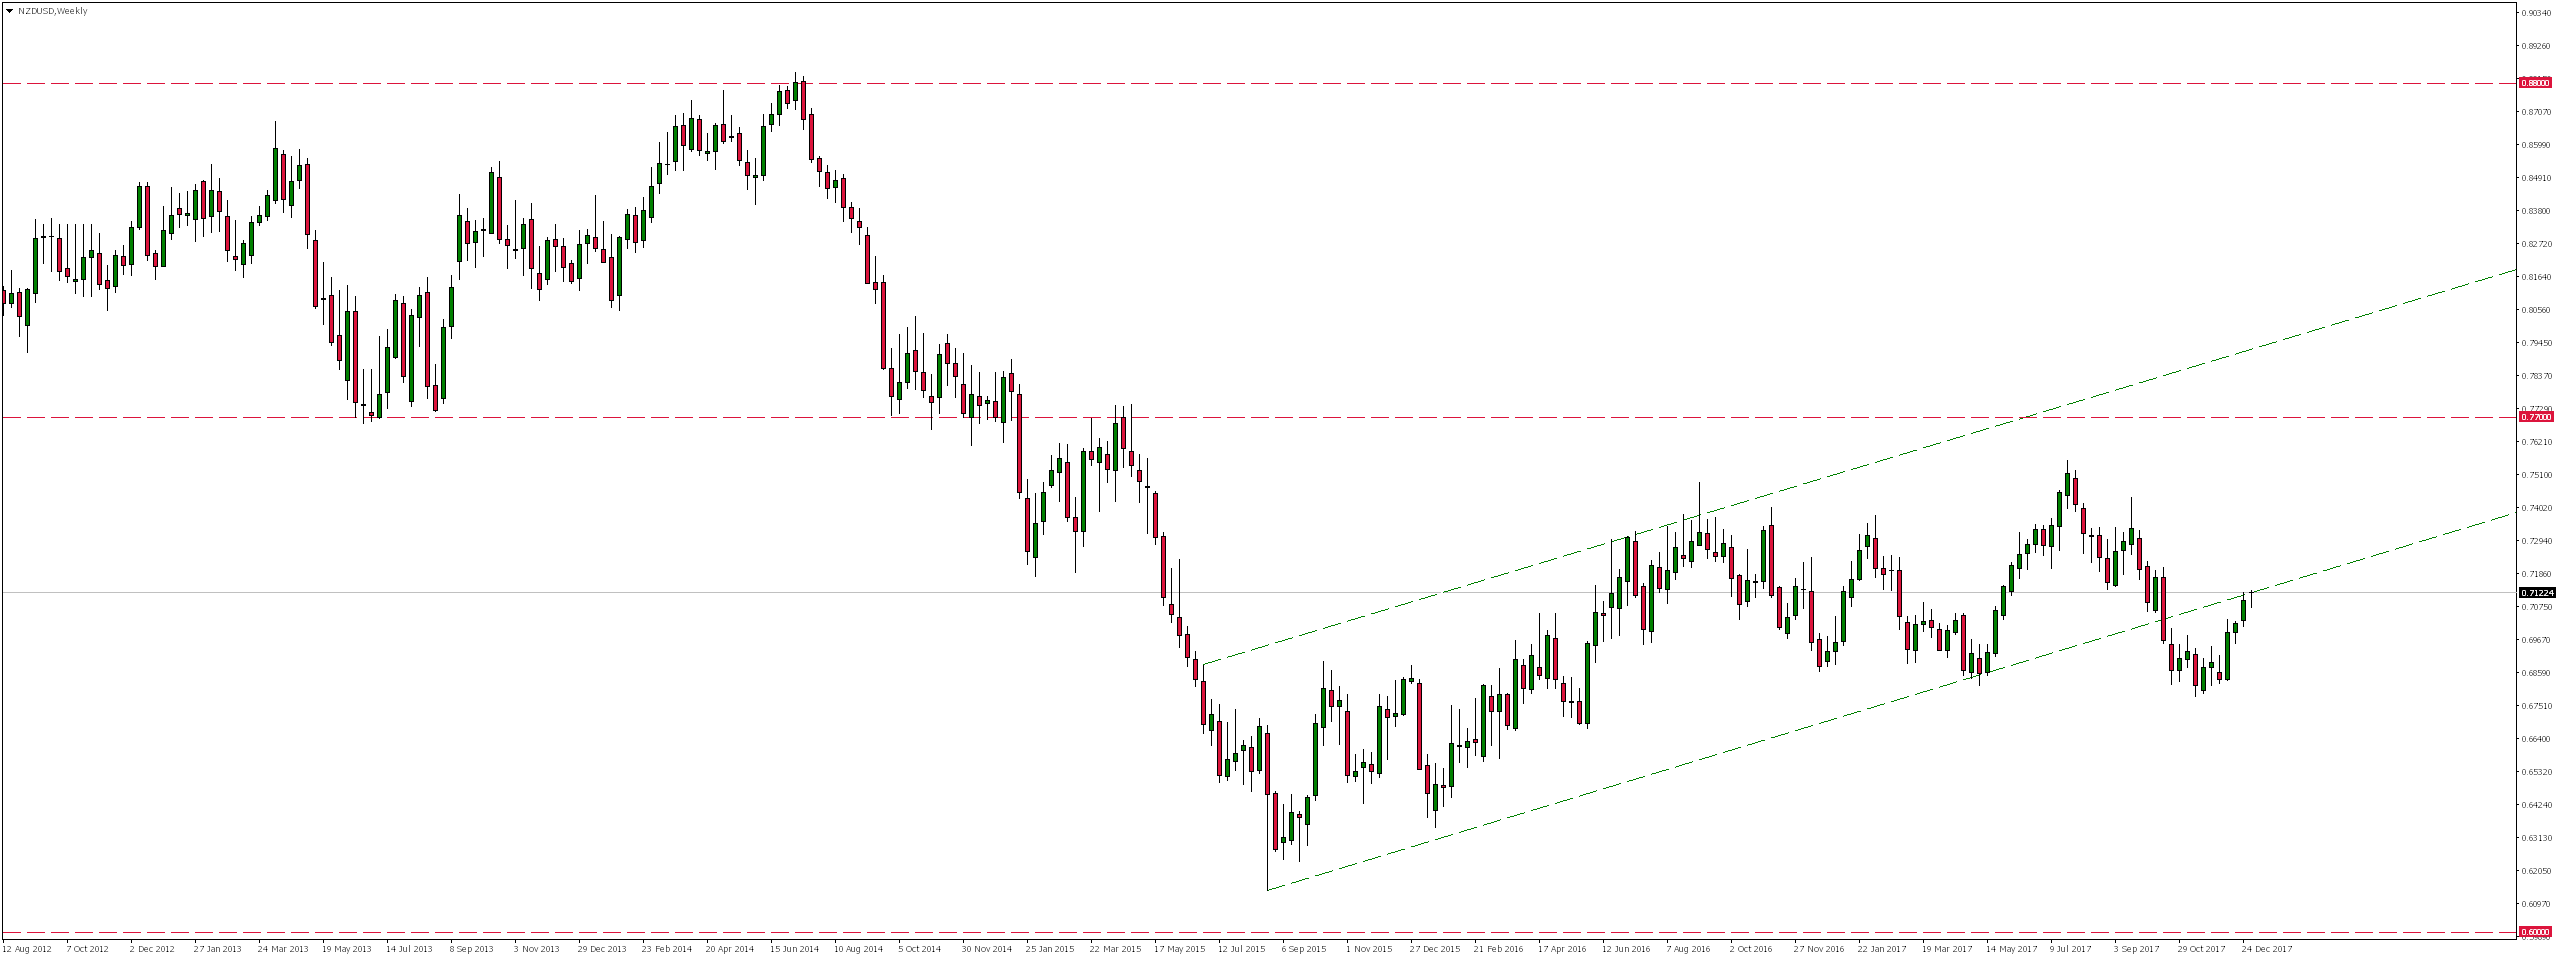
NZDUSD since setting formation of the double top around 0.8800 in July 2014 was moving south. Despite the fact that these decreases did not reach the level of 0.6000, in September 2015 the first demand reaction appeared and from that time we observed calm increases.

Looking at the weekly chart, we can see that the whole upward movement was located within the channel from which in mid-October last year we left thru the bottom. Later drops did not last too long, as a result of which we currently observe a re-test of the lower limit of this channel. Permanent rejection of this resistance could open the way to new declines.
Error, group does not exist! Check your syntax! (ID: 4)
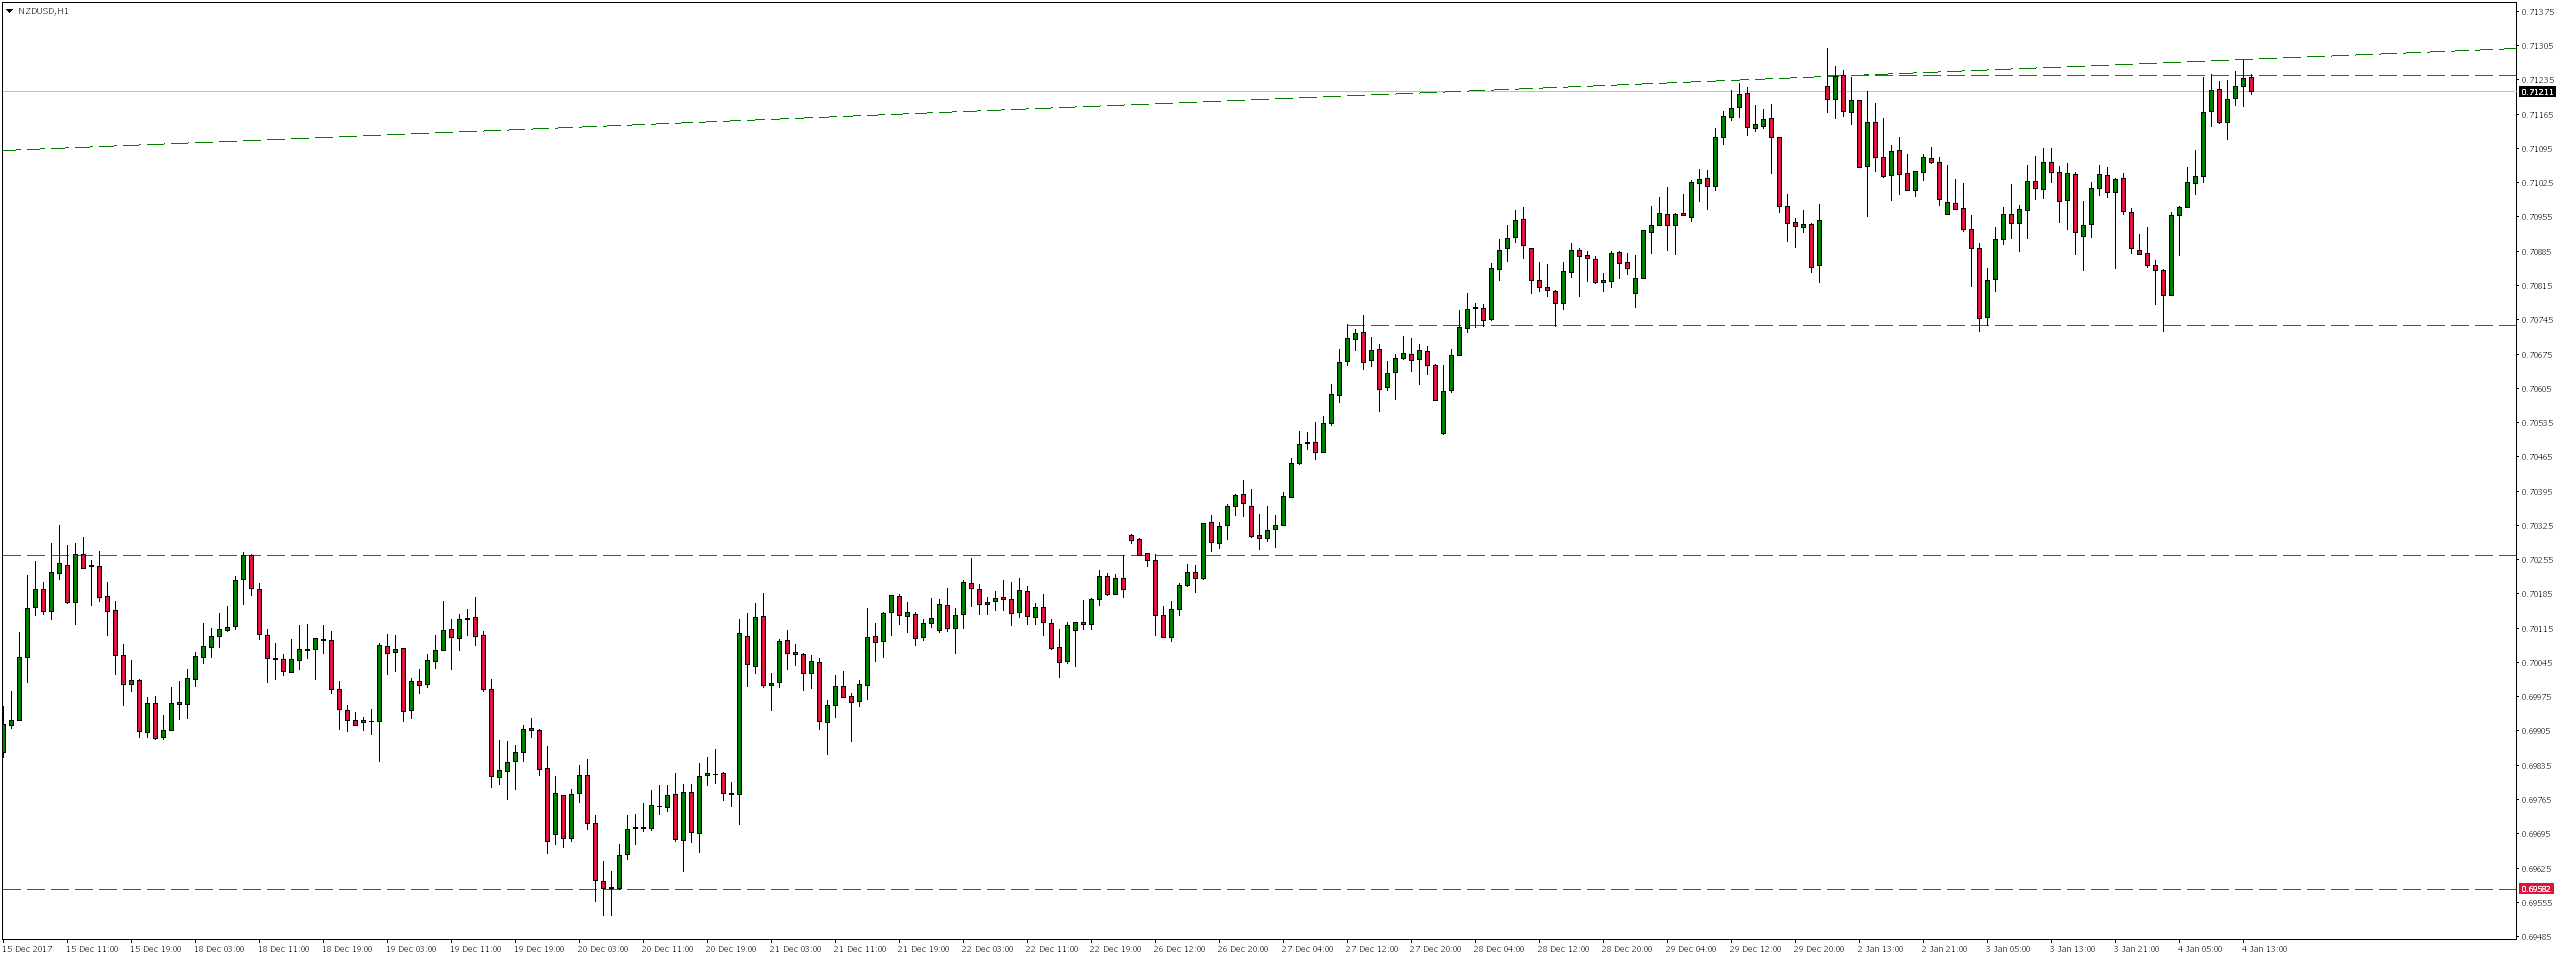
If this happens, potential drops could reach level 0.7073, which is the lower limit of consolidation lasting already one week or even to 0.7026 and further vicinity of 0.6960.


 Review")


