![]()
![]() From Investor to Scalper – series of studies created in cooperation with broker BDSwiss, in which we take a financial instrument and the analysis includes a detailed look at the value from the monthly chart and ending with H4/H1.
From Investor to Scalper – series of studies created in cooperation with broker BDSwiss, in which we take a financial instrument and the analysis includes a detailed look at the value from the monthly chart and ending with H4/H1.
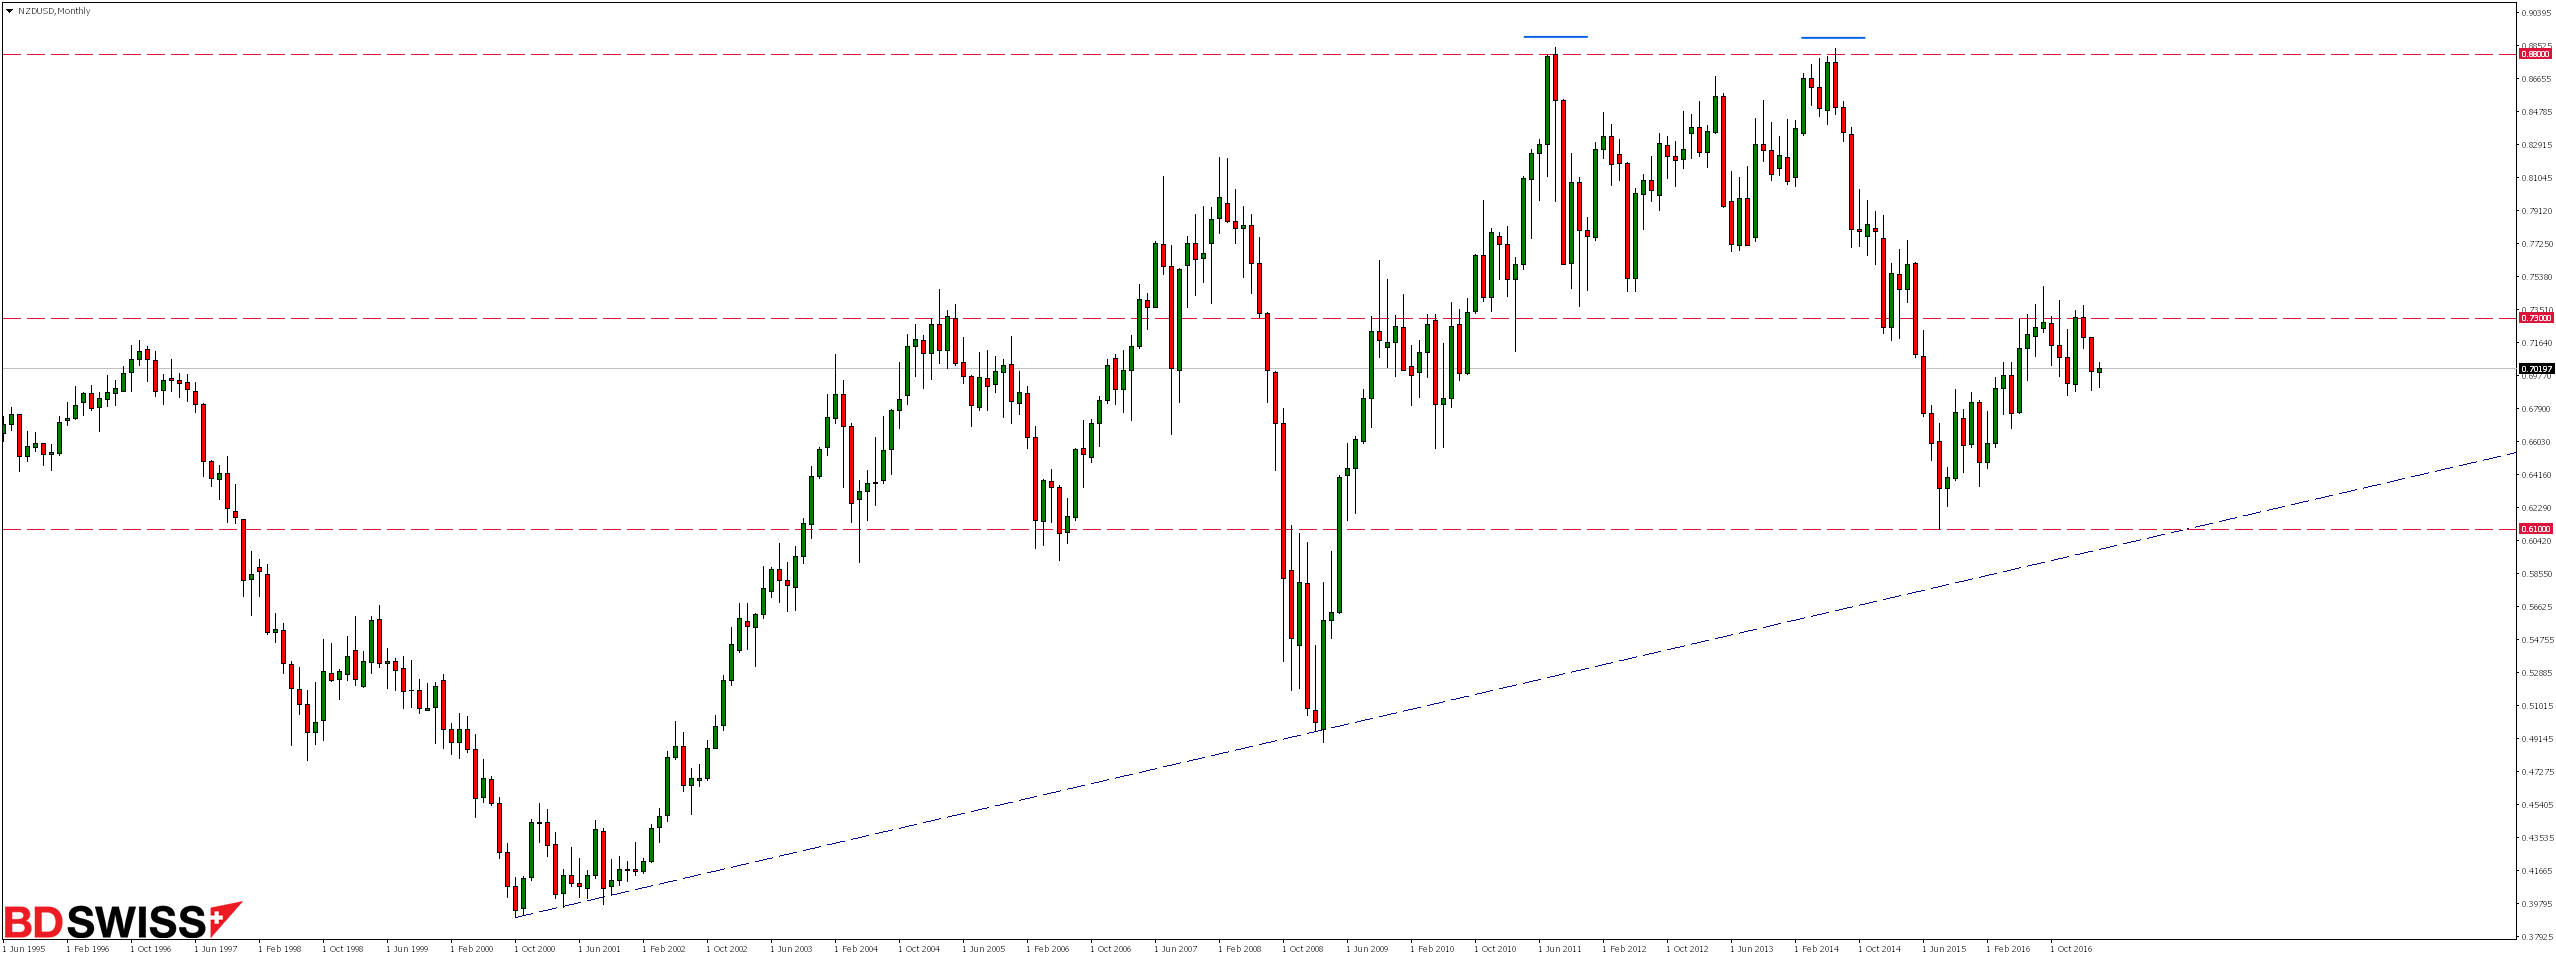
NZDUSD moved to the south since setting formation of double peak at 0.8800 in July 2014. As a result of these falls we have overcome local support zone around 0.7300, where after lasting from September 2015 bullish correction, in September 2016 first supply reaction emerged. This level was once again tested in January this year and from February we observe declines.
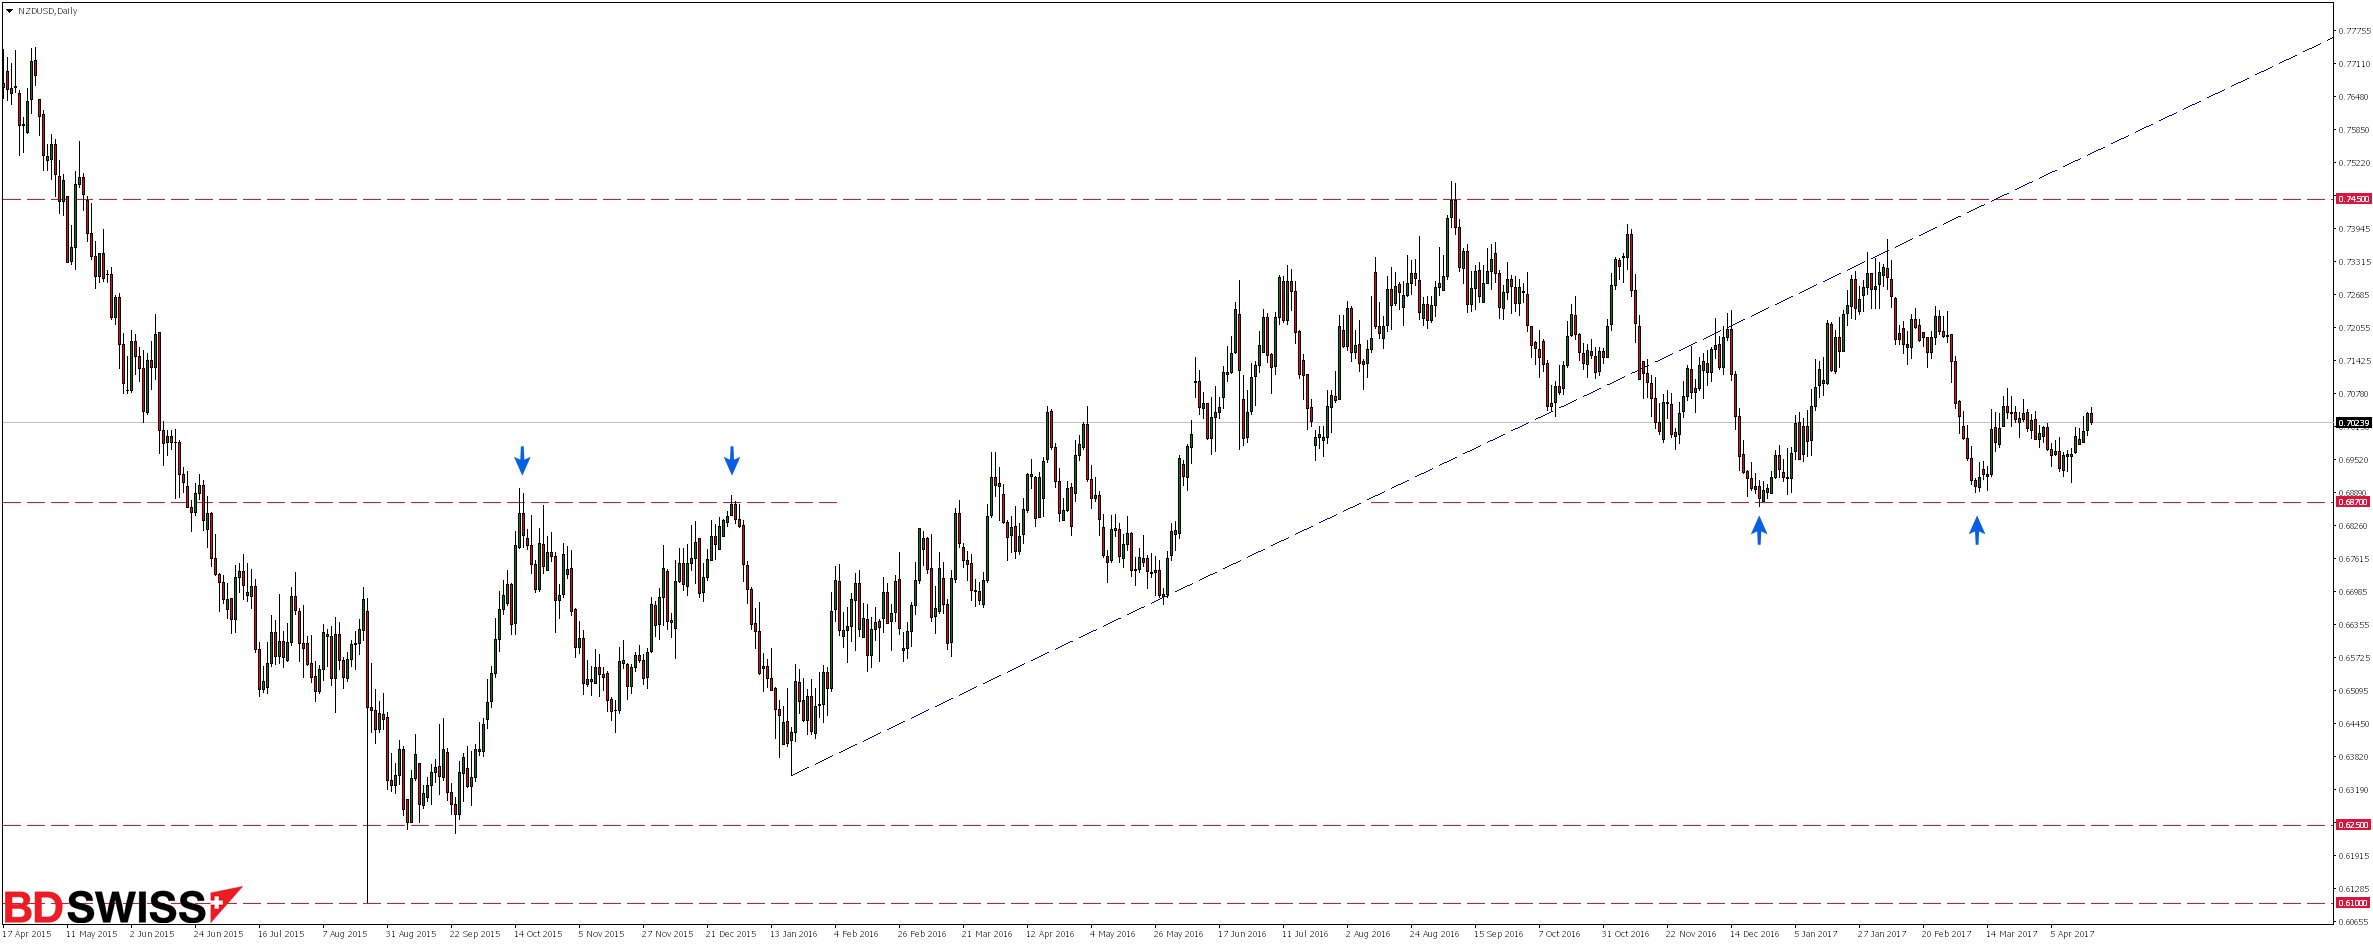
When we look at the daily chart, we note that after breaking the uptrend line, market has repeatedly re-tested it from below (as a resistance), and each time it fell back to 0.6870. This is exactly the same area, which already in October and December last year hindered demand for further growth. It now suppresses supply before further drops. At that time, the defeat took place at third approach, and this time will it do likewise?
On the H4 chart we can notice that the market has been moving in a consolidation since beginning of March. Although last week’s gains have not yet reached their upper limit, today a strong supply response has already emerged.

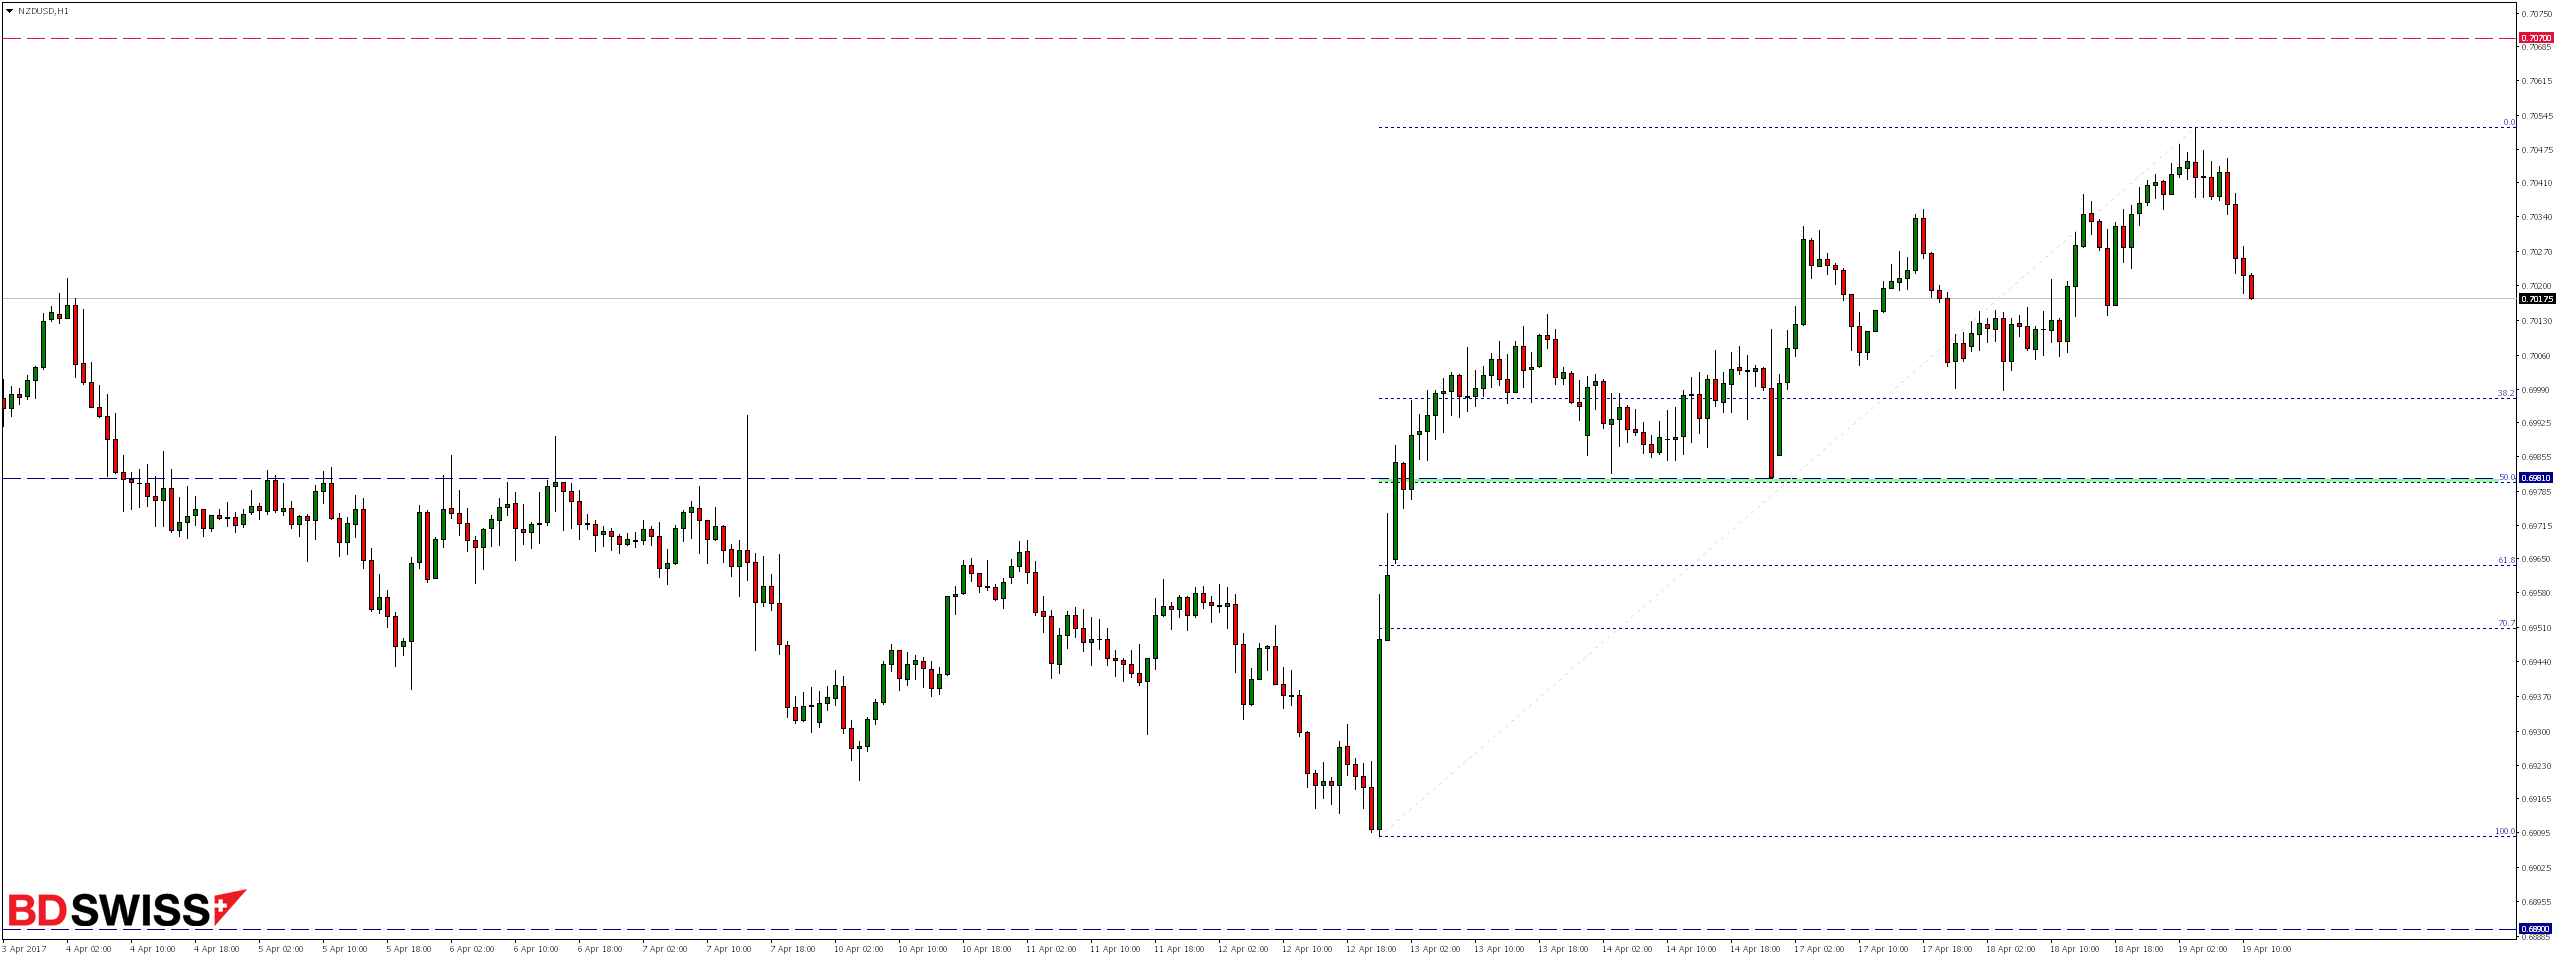
Looking at H1 chart, we will see that even if declines continue, the first demand response could be expected to be in the 0.6981 level It coincides with 50% of the Fibonacci correction, giving a drop potential of less than 40 pips.
BDSwiss offers its customers a sophisticated and reliable tool to invest in the market CFD / Forex. Especially novices can result in the safe introduction into the world of financial investments. The educational program of seminars and live comments market traders meet the expectations of those who want to learn how to invest successfully, which is building a great partnership between BDSwiss and its customers.


 Review")


