From Investor to Scalper is a cycle of analysis in which we take one financial instrument and the analysis includes a detailed look at the value from the monthly/weekly chart to the H1/M15.
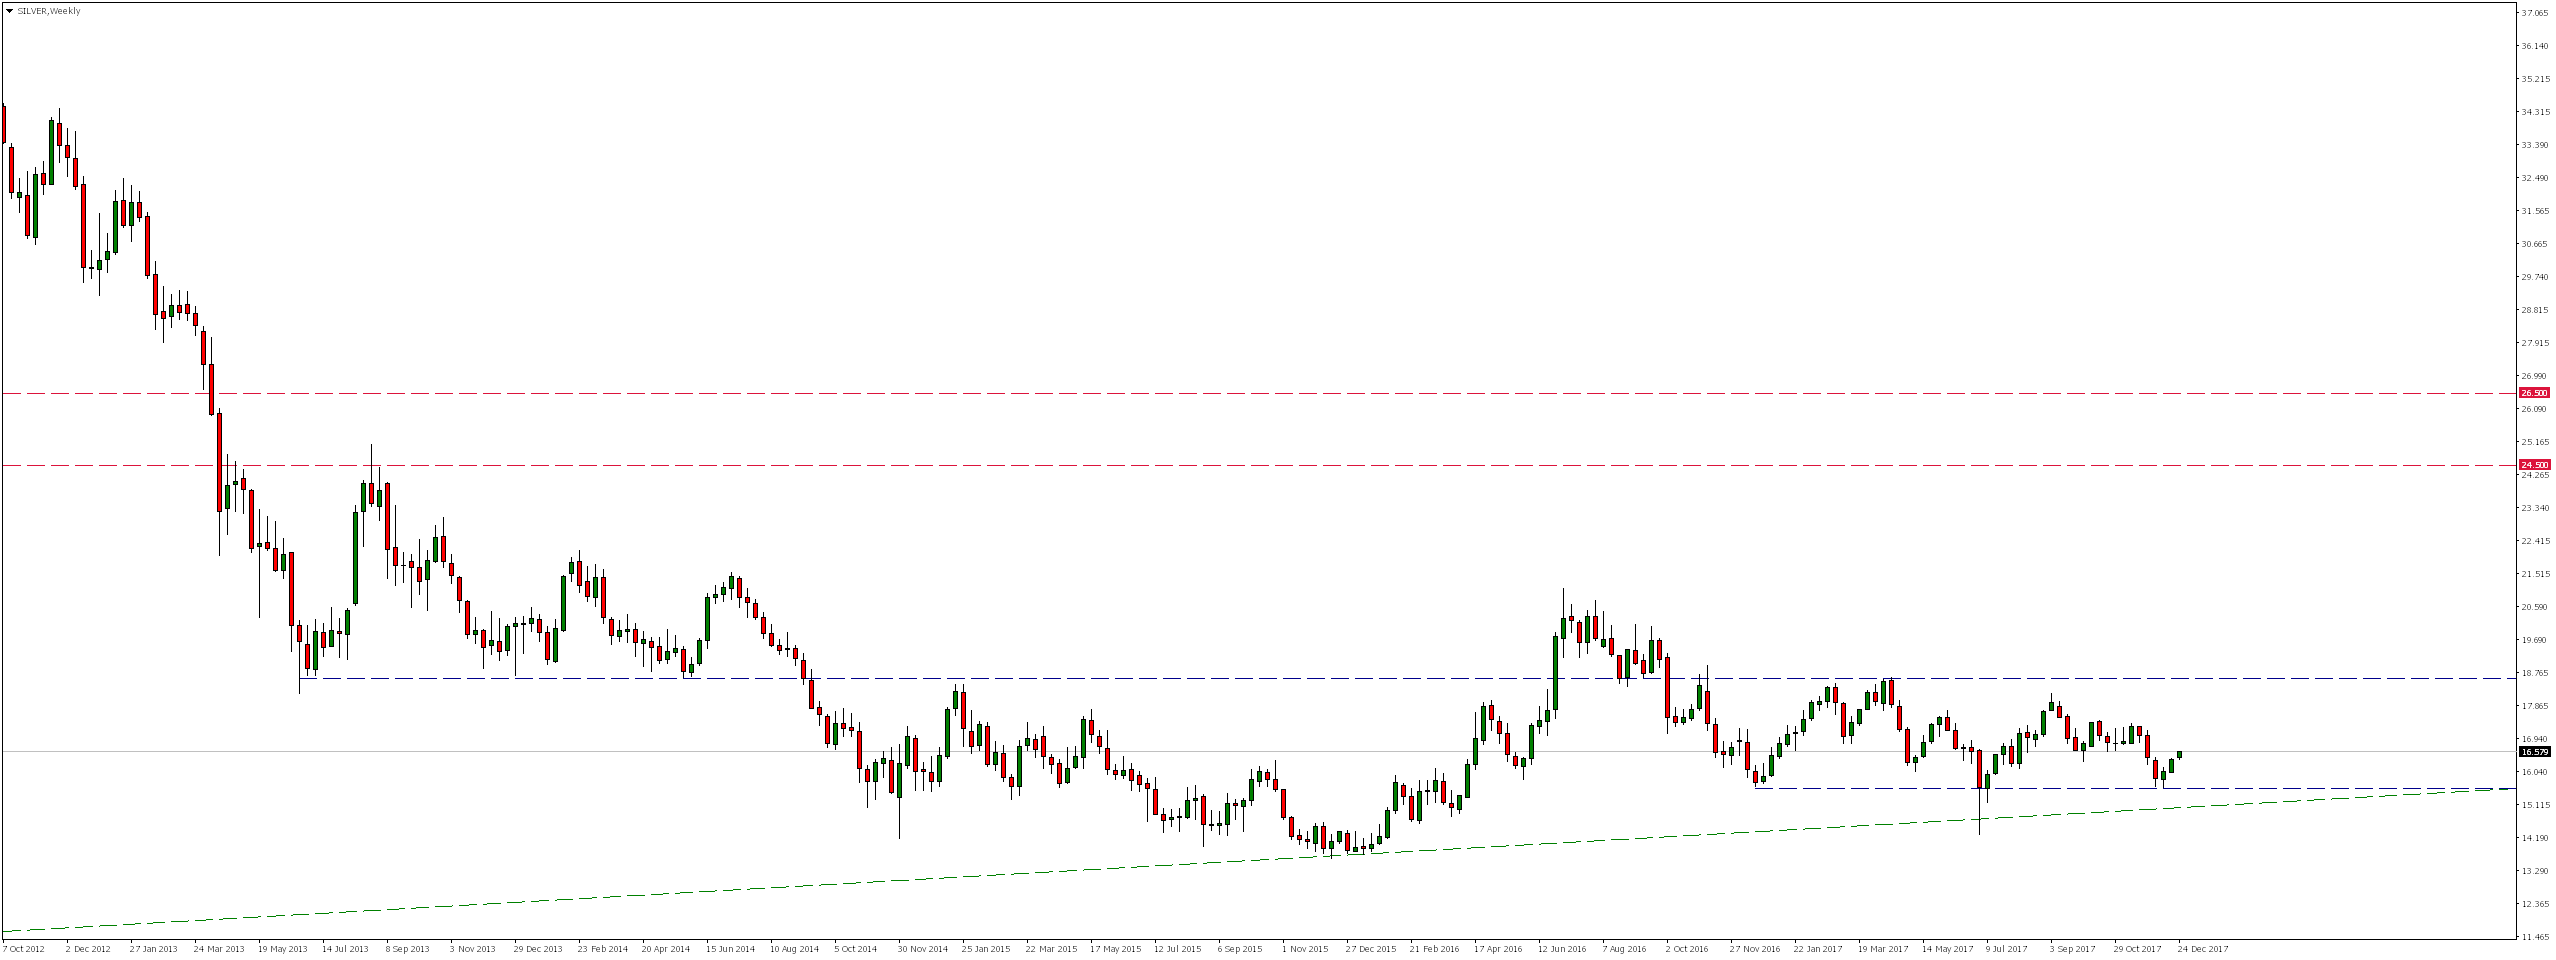
The SILVER market has been moving south since May 2011. As a result of these drops, the value of this metal dropped from 49.00 $ in April 2011. to 14.00 $ in December 2015 where, in the area of the upward trend line, a demand reaction appeared.

However, due to later increases the price beat resistance around 18.60, this breakout was quickly negated and price of Silver once again tested the upward trend line, where in the beginning of July a demand reaction appeared. Nevertheless, the market is still moving in a horizontal trend.
Looking at the daily chart, we notice that as a result of rejection of the lower limit of this consolidation, we have been seeing increases again for over two weeks.
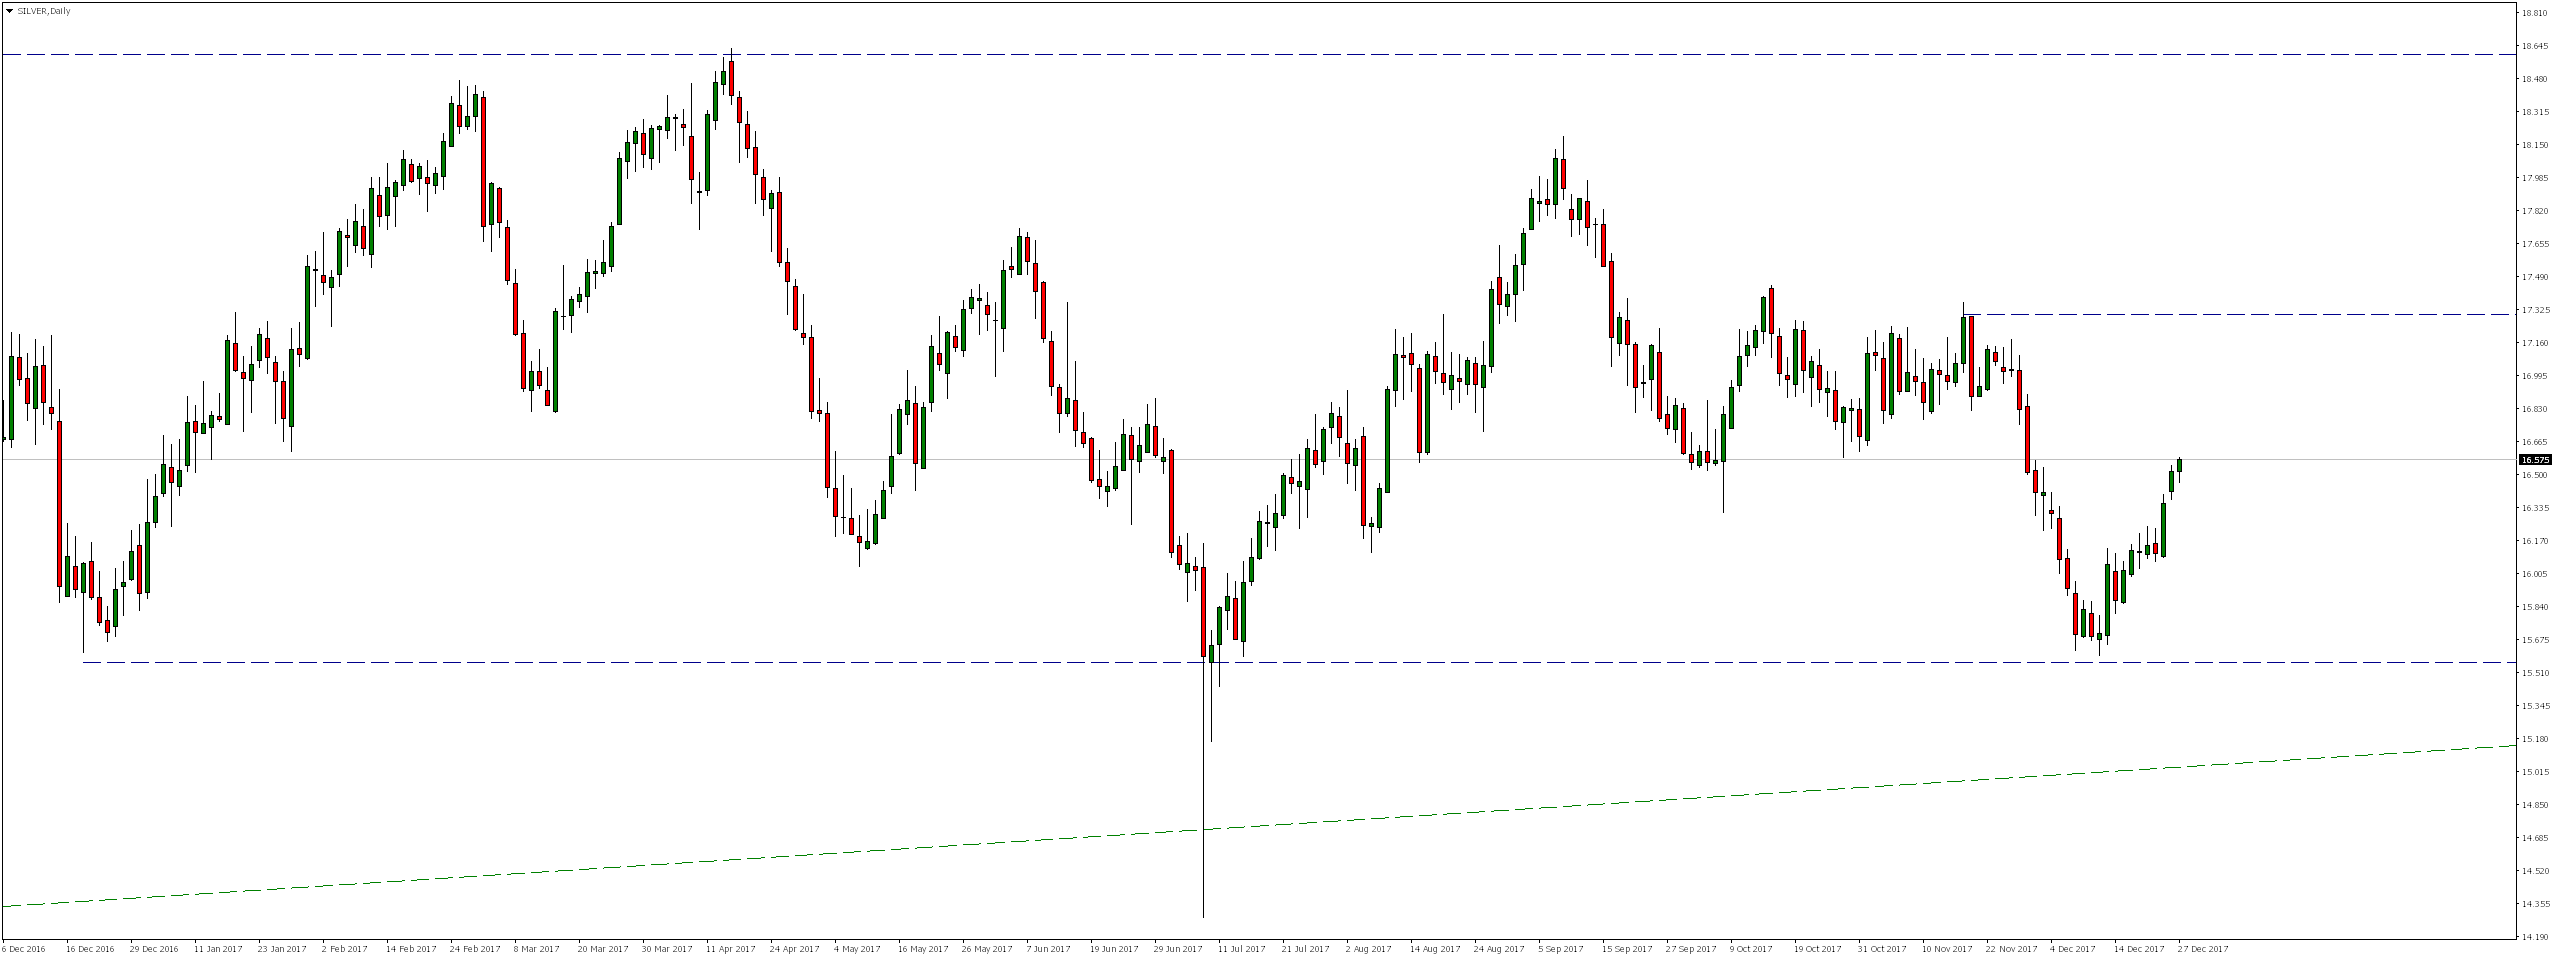
Currently, the rate is approaching local resistance and if only near this level appears supply reaction we should expect at least a downward correction.
Error, group does not exist! Check your syntax! (ID: 4)

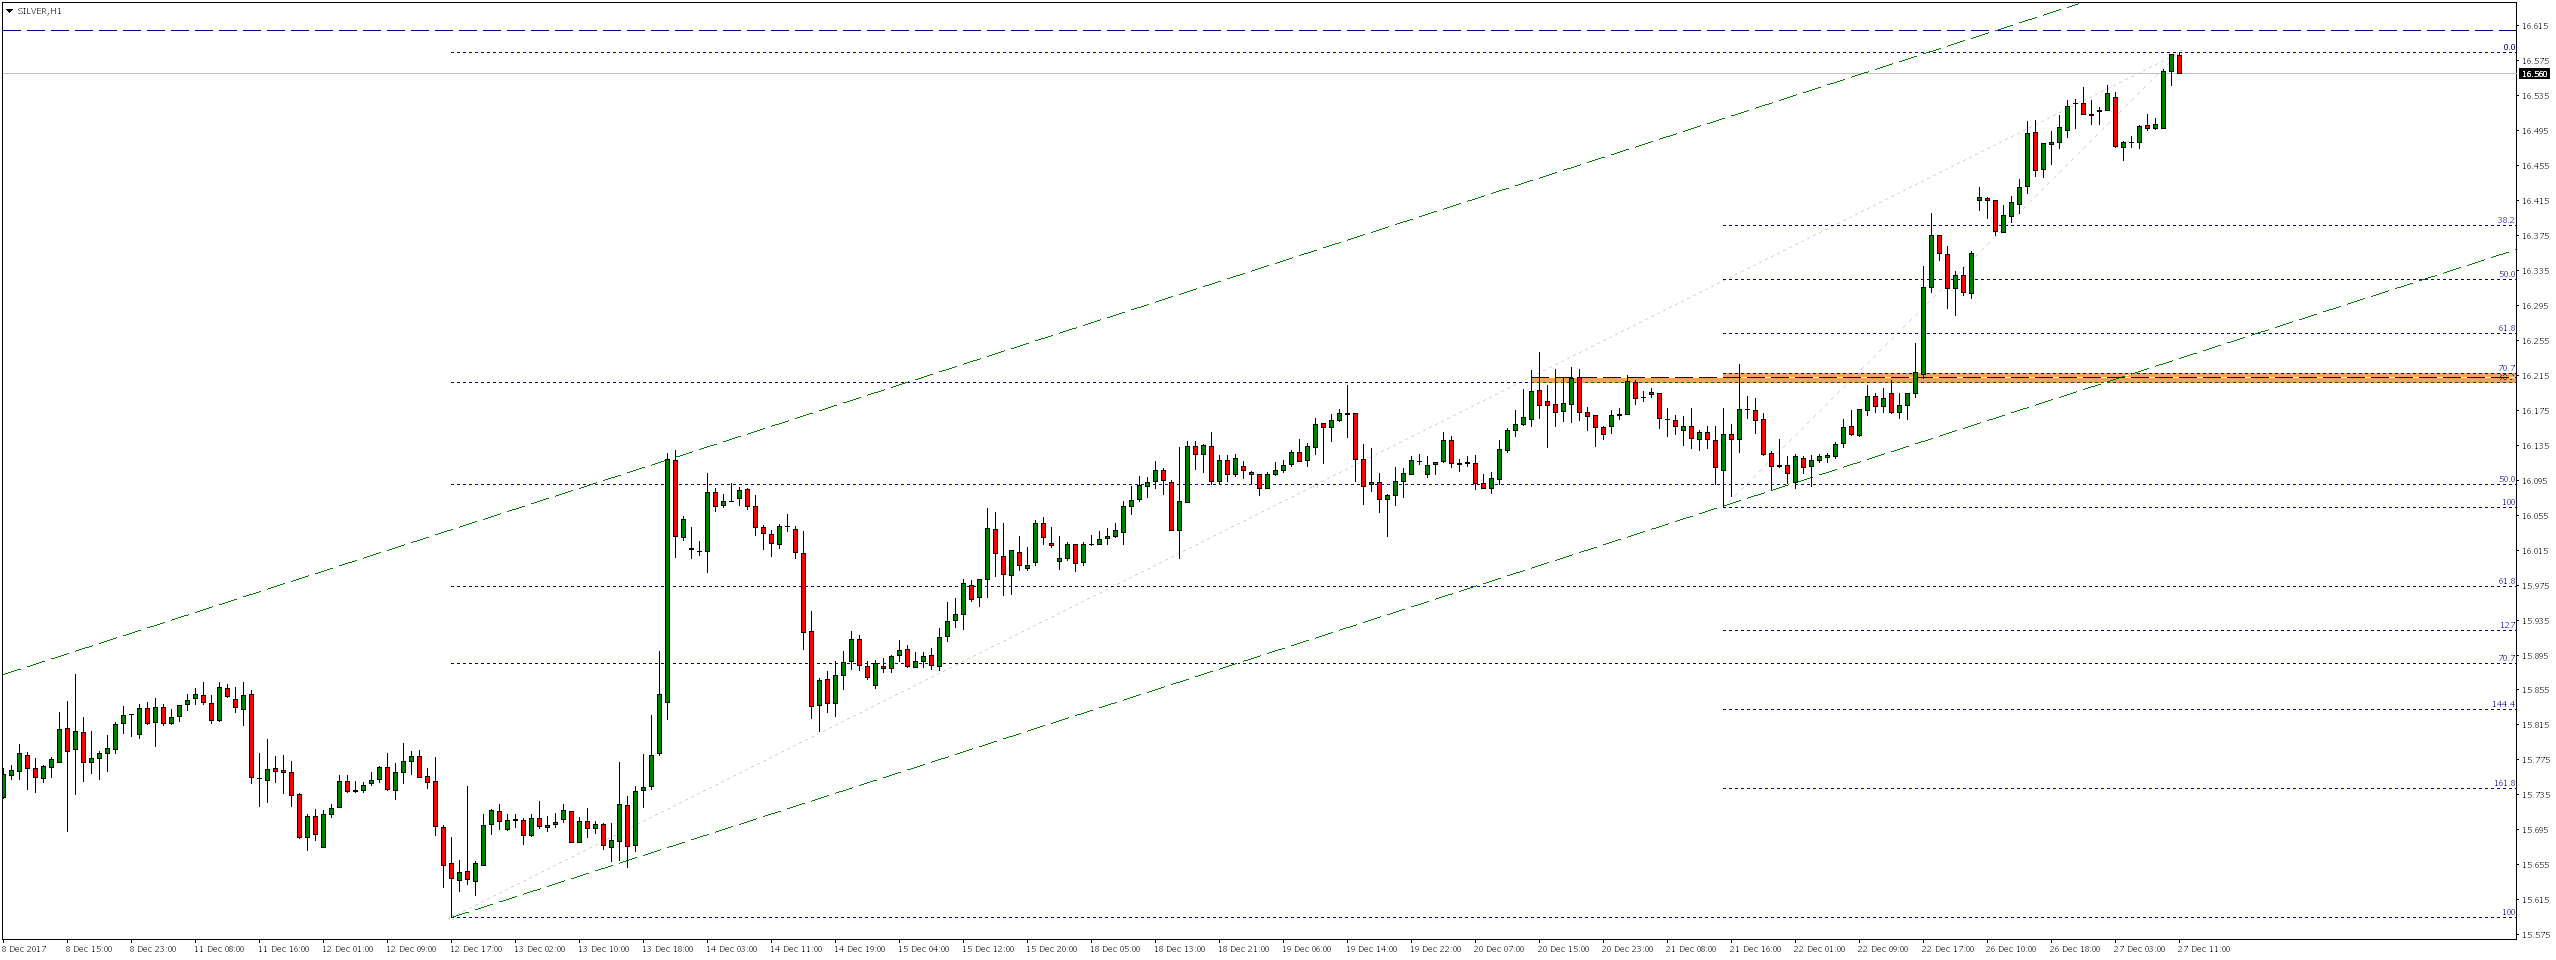
If this happens, potential declines could reach the upward trend line, or even around 16.21, coinciding with measuring the 70.7% Fibonacci correction from the last impulse and 38.2% from the entire upward movement.


 Review")


